


 Latin America
0


| Thumbs Up |
| Received: 12,362 Given: 11,959 |
ThisOriginally Posted by Litvin

| Thumbs Up |
| Received: 12,362 Given: 11,959 |
yes i also find it iteresting that the poorest people (D/E) is still in the balanced mestizo range. A very homogeneous population
If they did this in Argentina i would expect a big difference between the different social classes.


| Thumbs Up |
| Received: 477 Given: 324 |
This scenario happens in all our countries. Upper classes are more european, maybe just a little more, like in Chile.
| Thumbs Up |
| Received: 12,362 Given: 11,959 |
Brazil, Northeast, Fortaleza
We genotyped 2,010 DNA samples from six Brazil studies on the Affymetrix Axiom LAT-1 Latin American Array. These samples were drawn from six studies in the North-Eastern region of Brazil, centered on the city of Fortaleza, Ceará state, but also including six other towns or cities (fig. 1). After quality control, we were left with 1,538 samples unrelated to second degree, and 755,801 SNPs (table 1). The detailed quality control steps and results are available in supplementary table S1, Supplementary Material online.
https://www.ncbi.nlm.nih.gov/pmc/articles/PMC5430616/
The North-Eastern Brazilians had a mean ancestry of 57% European, 20% Amerindian, and 23% African although with considerable ranges of individual ancestries within each component (1995%, 249%, and 467%, respectively).

| Thumbs Up |
| Received: 12,362 Given: 11,959 |
NEW STUDY with several countries studied
https://www.ncbi.nlm.nih.gov/pmc/articles/PMC5460260/
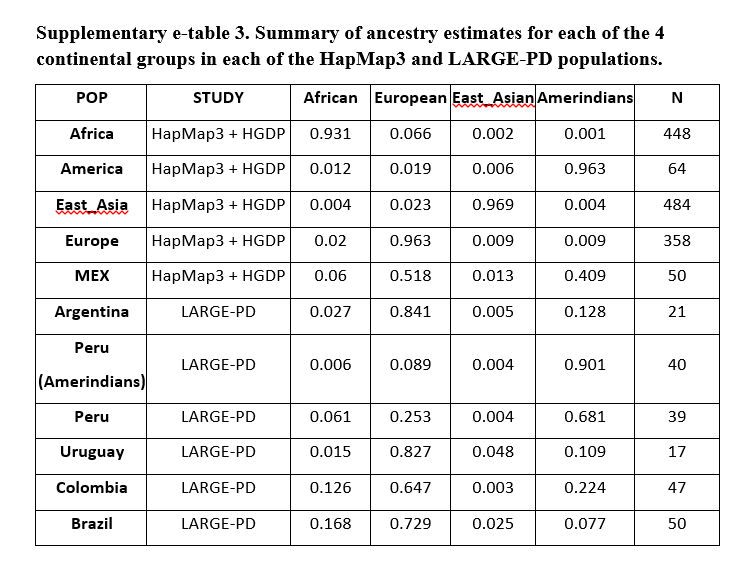
Variable frequency of LRRK2 variants in the Latin American research consortium on the genetics of Parkinson’s disease (LARGE-PD), a case of ancestry
Subjects
We screened a total of 1734 PD patients and 1097 healthy controls recruited in Argentina, Brazil, Colombia, Ecuador, Peru, and Uruguay as part of the Latin American Research Consortium on the Genetics of Parkinson’s disease (LARGE-PD). All patients were evaluated by a movement disorders specialist at each of the sites and met UK PD Society Brain Bank clinical diagnostic criteria. The characteristics of this cohort are presented in Table 1. Data for a subset of these subjects has been previously published in analyses of p.G2019S and codon 1441 mutations (n = 365), and for p.Q1111H (n = 940).12, 19
LARGE-PD analysis
We randomly sampled 214 individuals from the LARGE PD cohort as follows: 39 Peruvian mestizos; 40 Peruvian Ameridian; 17 Uruguayan; 21 Argentinian, 47 Colombian and 50 Brazilian. Based on HapMap III and HGDP, we constructed a combined reference panel consisting on European, Africans, Amerindians and East Asians for a total of 1354 individuals. We used STRUCTURE (http://pritch.bsd.uchicago.edu/structure.html) to estimate the percent ancestry for our samples with reference to the HDGP+HapMap Phase III groups. Thus, we assumed k=4 ancestral groups, 10,000 burn-in iterations and 20000 MCMC iterations and default settings. We made 4 different runs and then used CLUMPP to align these runs and took the average of the 4 runs sorted by percentage of European ancestry (Supplementary e-table 3).
Last edited by Argentano; 07-03-2017 at 02:55 AM.
| Thumbs Up |
| Received: 12,362 Given: 11,959 |
Not genetic but about surnames in brazil
https://www.ncbi.nlm.nih.gov/pmc/articles/PMC5421764/
This paper presents a method for classifying the ancestry of Brazilian surnames based on historical sources. The information obtained forms the basis for applying fuzzy matching and machine learning classification algorithms to more than 46 million workers in 5 categories: Iberian, Italian, Japanese, German and East European. The vast majority (96.7%) of the single surnames were identified using a fuzzy matching and the rest using a method proposed by Cavnar and Trenkle (1994). A comparison of the results of the procedures with data on foreigners in the 1920 Census and with the geographic distribution of non-Iberian surnames underscores the accuracy of the procedure. The study shows that surname ancestry is associated with significant differences in wages and schooling.
Given the superiority of the Cavnar and Trenkle algorithm compared to the Naïve Bayes, only the former are presented. In terms of classifying unique surnames present in the RAIS, the results are set out in column 1 of the Table 5. Those percentages do not reflect the ancestry of the population because the concentration of surnames varies from one ancestry to another. It is more interesting to examine columns 2 and 3, which present the distributions of the population by ancestries. Around 16.3% have at least one Germanic, East European, Italian or Japanese surname and 11.9% have a non-Iberian last or unique
Ancestry Acronym (1)
% of unique surnames (2)
# of individuals (3)
% of individuals
Iberian IBR 27.4% 41,215,227 88.1%
Italian ITA 32.4% 3,377,695 7.2%
German GER 20.5% 1,504,894 3.2%
Eastern Europe EAS 13.1% 392,708 0.8%
Japanese JPN 6.6% 311,488 0.7%
Total 100% 46,802,012 100%
Index of non-Iberian surnames by municipality.
Note: index = 1 for individuals with exclusively non-Iberian surnames; index = 0.5 for one Iberian and one non-Iberian surnames; index = 0 for exclusively Iberian surnames. Map shows the rate of the sum of the index by the number of individuals in each municipality.

| Thumbs Up |
| Received: 12,362 Given: 11,959 |
Brazil and Mexico
http://journals.plos.org/plosone/art...l.pone.0112640
The sample from Brazil included 268 individuals from the southeastern state of Rio de Janeiro, and was stratified into census categories. The sample from Mexico comprised 45 Native American Zapotecas and 224 self-identified Mestizo individuals from 5 states located in geographically distant regions in Mexico. We evaluated the admixture proportions in the Brazilian and Mexican samples using a panel of Ancestry Informative Markers extracted from the DMET array, which was validated with genome-wide data
Table 1 shows the average African, European and Native American genetic contributions to the Brazilian sample stratified by census categories, and to the Mexican sample stratified by State. The average African, European and Native American contributions to the Brazilian sample were estimated to be 29%, 62% and 7% respectively. The African contribution is highest for Black Brazilians (54% vs. 25.3% in Brown and 9.7% in White individuals). Conversely, the European contribution is highest for the White category (84.6% vs. 64.7% in Brown and 38% in Black individuals). The average Native American ancestral contributions range between 5.6% and 10% across the 3 Color groups. In contrast to Brazil, where the major ancestral contributions are from Europe and Africa, in Mexico the predominant ancestral contributions are Native American and European (55.9% and 38.8%, respectively), with a relatively small contribution from Africa (5.3%). There is evidence of geographic variation in ancestral contributions in Mexico, with higher European admixture in the Mestizo sample from the State of Sonora in the North (70% vs. 18% in Guerrero) and higher Native American contributions in the state of Guerrero (74% vs. 26% in Sonora). We observed a substantial variation of individual admixture proportions in the samples of Mexico and Brazil, as depicted in Figure S1, which shows the individual admixture estimates using a bar plot.

| Thumbs Up |
| Received: 12,362 Given: 11,959 |
Uruguay Mtdna
https://www.ncbi.nlm.nih.gov/pmc/articles/PMC5530489/
Mitochondrial DNA ancestry
The analysis of mtDNA revealed that the contributions from the three parental groups were 6.6% African, 24% Native American and 69.3% European. Among the controls, 3.1% of individuals carried an African haplogroup, 26.5% a Native American haplogroup, and 70.4% a European haplogroup, whereas among the cases, the respective figures were 7.5%, 27.4% and 65.1% (Table (Table2).2). The case and control groups were not different from each other (p = 0.35). A detailed distribution of each mitochondrial haplogroup analysed is also shown in Table Table22.


| Thumbs Up |
| Received: 19,481 Given: 36,899 |
I think Chile is more Euro than Amerindian. Perhaps something like 55/45 or 60/40.
My Updated 23andme Results (2021)
My Updated AncestryDNA Results (2022)
My Global25 Coordinates (2020)
An Epic Thread about me opened by Profield
| Thumbs Up |
| Received: 12,362 Given: 11,959 |
There are currently 1 users browsing this thread. (0 members and 1 guests)
 Posting Permissions

 Reply With Quote


Bookmarks