

2


| Thumbs Up |
| Received: 1,328 Given: 1,050 |
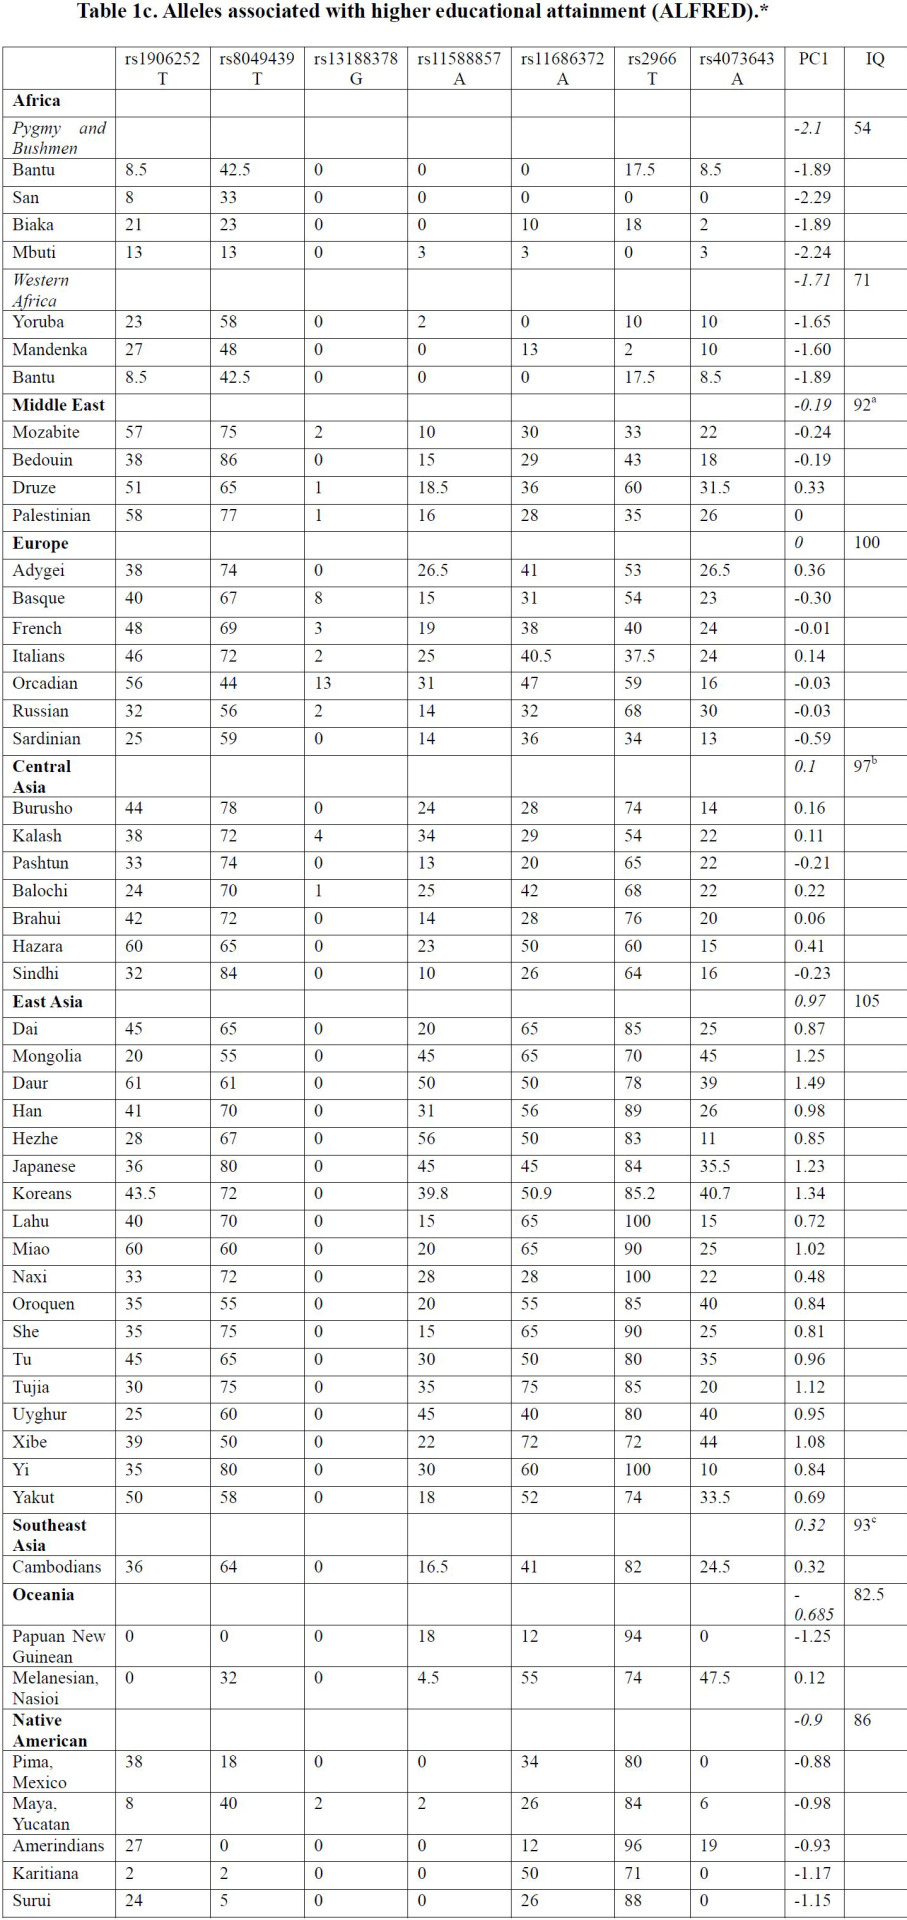
Below are charts showing the distribution of all 14 alleles across 4 racial groups. The data was taken from ALFRED but, as we have already seen, the pattern is consistent across other databases as well. (The first chart is for an allele associated with lower than average cognitive ability. All the others alleles are positively associated with intelligence.)
http://therightstuff.biz/2015/09/02/...e-differences/


| Thumbs Up |
| Received: 20,924 Given: 18,997 |
I wonder if this one is of Neanderthal origin ???:

| Thumbs Up |
| Received: 8,888 Given: 2,144 |
Should be noted that these various alleles are for various forms of intelligence, some correlate with visual IQ, others correlate with Verbal IQ, Rs3227 is associated with mere educational attainment, etc.
Originally Posted by Litvin

No.
| Thumbs Up |
| Received: 20,924 Given: 18,997 |
In a way it's good news that there are actually specific, identifiable alleles responsible for intelligence.
It means that it should become possible in the future to raise human IQ by means of genetic engineering.
Something more about IQ-related alleles:
How do you know? It has not been found in Neanderthal aDNA samples ???


| Thumbs Up |
| Received: 780 Given: 275 |
But I thought all the races were the same!
| Thumbs Up |
| Received: 20,924 Given: 18,997 |
Well - 1 out of 6 Blacks is still more intelligent than 50% of Whites.
So it's not like there are no intelligent Blacks, of course there are. And IQ among Blacks would be increasing in each generation under selective pressures if not your social welfare system. Had there been no welfare system, intelligent people - when living in a civilized society like American one - would be having more surviving children than less intelligent ones. Due to social selection and economic selection. Without support from the state most of unemployed single moms and their kids would starve, immediately boosting average IQ of surviving Blacks:
Last edited by Peterski; 09-15-2015 at 07:19 PM.
| Thumbs Up |
| Received: 20,924 Given: 18,997 |
Of course IQ is not everything, there are also personality traits. A person like Forrest Gump would make a good citizen in a modern society as despite his dumbness, he had many positive personality traits (I wonder what outrage would there be, if Gump in the movie was Black, hehe):
:icon_cheesygrin:
| Thumbs Up |
| Received: 20,924 Given: 18,997 |
More detailed frequencies for these alleles can be found here:
http://arkaimcity.tumblr.com
From D. Piffer's study:
http://emilkirkegaard.dk/en/wp-conte...ent-and-IQ.pdf
http://41.media.tumblr.com/c4a26b206...o2_r2_1280.jpgThe results are similar across the HapMap and 1000 Genomes data sets: East Asian populations (Japanese, Chinese) have the highest average frequency of “beneficial” alleles (39%), followed by Europeans (35.5%) and sub-Saharan Africans (16.4%). […] Factor analysis showed that they are strongly statistically associated at the population level, and the resulting factor score was highly related to average population IQ (r=0.90). Moreover, allele frequencies were positively correlated with aggregate measures of educational attainment in the population, average IQ, and with two intelligence increasing alleles that had been identified in different studies. […] The polygenic score of educational attainment alleles was a good predictor of PISA scores (r=0.84, p<.05).
Another chart:
http://41.media.tumblr.com/ed8311e1f...10_r1_1280.jpg
Last edited by Peterski; 09-18-2015 at 02:34 PM.

| Thumbs Up |
| Received: 3,391 Given: 6,153 |
Are those numbers correct? I could only find the first 3 and the last 2
| Thumbs Up |
| Received: 20,924 Given: 18,997 |
Also interesting thing is, that Middle Easterners and Central Asians have similar frequencies of IQ-boosting alleles as Europeans.
This implies, that non-genetic factors are to be blamed for their lower IQs, such as - for example - Muslim inbreeding. Citation:
http://emilkirkegaard.dk/en/wp-conte...ent-and-IQ.pdf
About Muslim inbreeding and its negative impact on Muslim intelligence: https://www.google.pl/search?client=...UTF-8&oe=UTF-8On the other hand, populations from Central Asia and the
Middle East had factor scores comparable to Europeans,
suggesting that their lower average IQs can be improved
through better environmental conditions (nutrition,
schooling, [outbreeding - my note], etc.). Finally, the
lowest factor scores were observed in the San and Pygmy ethnic
groups, which accordingly have the lowest predicted IQ
There are currently 1 users browsing this thread. (0 members and 1 guests)
 United States
 Posting Permissions


 Reply With Quote
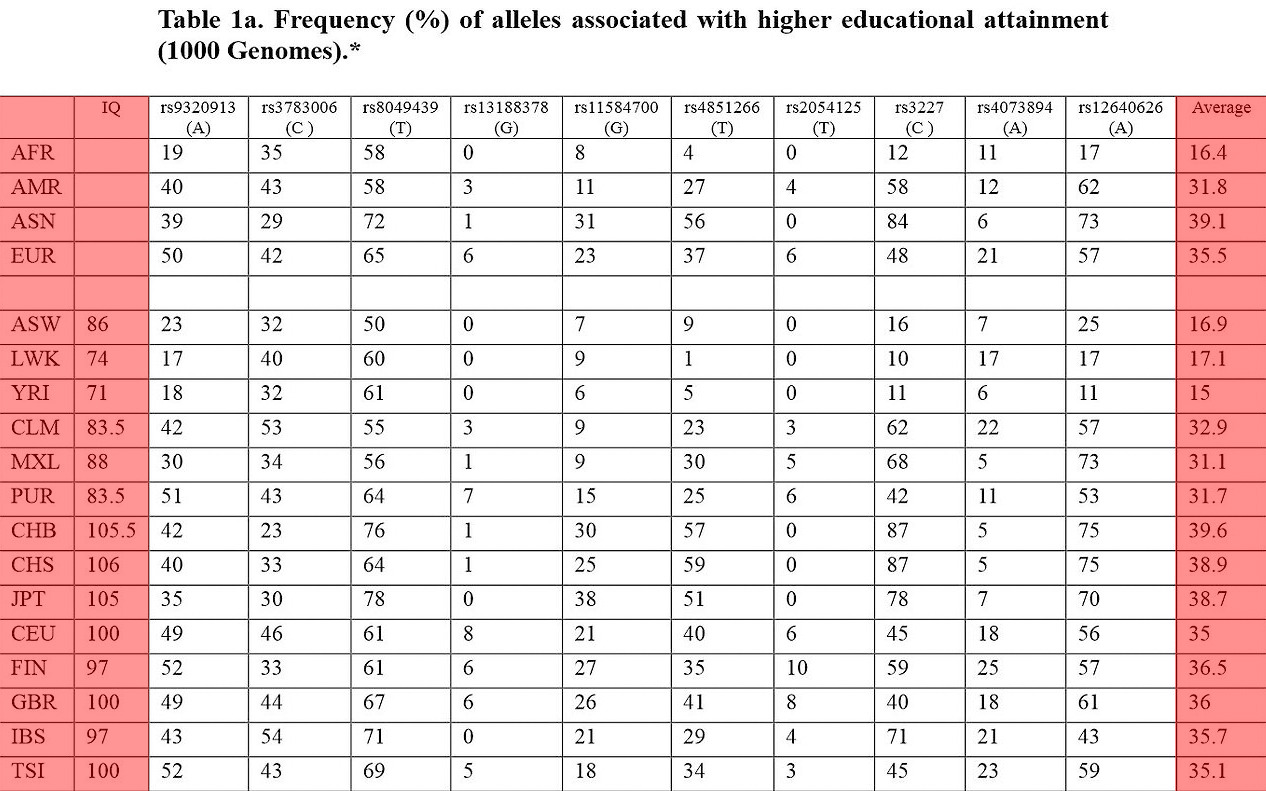
Bookmarks