

1


No
Yes


| Thumbs Up |
| Received: 29,515 Given: 15,680 |
I have the info from 23andme . the average user there is supposedly 2.7% neanderthal . I score 2.7% there

| Thumbs Up |
| Received: 8,888 Given: 2,144 |
23andme recently revised its archaic DNA protocol to bring it up to par with the newer, complete data. People who used to get 2.9% now get 1.1 or 1.2%.Originally Posted by All-In


| Thumbs Up |
| Received: 2,896 Given: 852 |
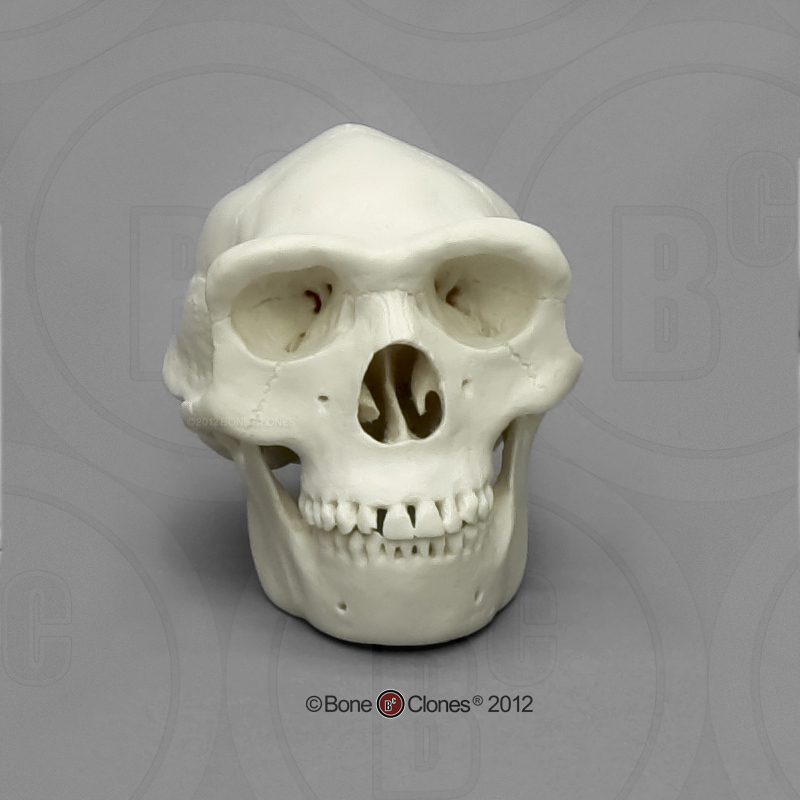
Their skulls don't match up to those of archaic hominids.
Australoid:
Erectus:
This Eskimo is more archaic than an Australoid


| Thumbs Up |
| Received: 2,399 Given: 3,254 |
Ancient australian fossils had much larger brains. Somehow they degenerated into pinheads with robust faces, probably genetic drift from very small populations I guess.
If it weren't for us you'd be speaking German. Instead, you'll be speaking Arabic.
http://simplicitymultiplied.blogspot.com/

| Thumbs Up |
| Received: 5,491 Given: 3,609 |
Economy model biological bipedal rape machines took over.


| Thumbs Up |
| Received: 780 Given: 275 |
Yea, Australoids and the San Bushmen are living breathing subhumans. They should be studied intensively and then wiped out.


| Thumbs Up |
| Received: 14,012 Given: 11,416 |


| Thumbs Up |
| Received: 20,923 Given: 18,997 |
They might have up to 20% archaic admixture (from 3 different hominins), according to this discussion:
http://www.anthrogenica.com/showthre...l=1#post173876
But these are extremely high estimates. It is more likely that they have up to 10% (or less) of archaic.
Here are GEDmatch results of a native Australian (but GEDmatch doesn't really show archaic ancestry):
http://www.theapricity.com/forum/sho...Australian-DNA
Last edited by Peterski; 12-06-2016 at 01:39 AM.
| Thumbs Up |
| Received: 20,923 Given: 18,997 |
There is also a new (September 2016) study about Australian Aborigines:
Main Paper:
http://sci-hub.cc/http://www.nature....ture18299.html
Supplementary Info:
http://www.nature.com/nature/journal...re18299-s1.pdf
Extended Data:
http://www.nature.com/nature/journal...#extended-data
This study estimates Denisovan admixture in Australians at 4 to 5 percent:
4-5% Denisovan + 2-3% Neanderthal = 6-8% archaic already. And there could be more.By constraining Denisovan admixture as having occurred before the Aboriginal Australian–Papuan divergence, the SFS-based approach results in an admixture estimate of ~4.0% (95% CI 3.3–5.0%, Fig. 4, Supplementary Information section S07), similar to that obtained by D-statistics (~5%, Supplementary Information section S09). The SFS analyses further suggest that Denisovan/Australo-Papuan admixture took place ~44 kya (95% CI 31–50 kya, Supplementary Information section S07), a date that overlaps with an estimate from a more recent study54.
The SFS analysis also provides evidence for a primary Neanderthal admixture event (~2.3%, 95% CI 1.1–3.5%) taking place in the ancestral population of all non-Africans ~60 kya (95% CI 55–84 kya, Fig. 4, Supplementary Information section S07). Although we cannot estimate absolute dates of archaic admixture from the lengths of PDHs and putative Neanderthal-derived haplotypes (PNHs) in our samples, we can obtain a relative date. We found that, for putatively unadmixed Aboriginal Australians and HGDP-Papuans, the average PNH and PDH lengths are 33.8 kb and 37.4 kb, respectively (Extended Data Fig. 3b). These are significantly different from each other (P= 9.65×10⁻⁶ using a conservative sign test), and suggest that the time since Neanderthal admixture was about 11% greater than the time since Denisovan admixture, roughly in line with our SFS-based estimates for the Denisovan pulse (31–50 kya, Fig. 4) versus the primary pulse of Neanderthal admixture (55–84 kya).
The SFS analysis also indicates that the main Neanderthal pulse was followed by a further 1.1% (95% CI 0.2–2.7%, Fig. 4, Supplementary Information section S07) pulse of Neanderthal gene flow into the ancestors of Eurasians.
Finally, using our SFS- and haplotype-based approaches, we explored additional models involving complex structure among the archaic populations. We found suggestive evidence that the archaic contribution could be more complex than the model involving the discrete Denisovan and Neanderthal admixture pulses8,9 shown in Fig. 4 (Supplementary Information sections S07, S10).
So I guess we can round this up and say that Australians have 1/10 archaic admixture.
At least 1/10, up to 1/5 (according to the most extremely high estimate given before).
This paper actually says that 37,000 years ago there was probably a bottleneck in Australia.
Their population declined and only one group survived and re-populated the whole continent.
Last edited by Peterski; 12-06-2016 at 01:33 AM.
| Thumbs Up |
| Received: 20,923 Given: 18,997 |
I agree. But not only, also with Neanderthals and Denisovans (unless Denisovans = Erectus).
They might be kinda "Castizos" - 80% Human and 20% Erectus+Denisovan+Neanderthal.
Or - more likely - around 90% Human and around 10% Erectus+Denisovan+Neanderthal.
Of course it was Late Erectus, like NG6 - https://en.wikipedia.org/wiki/NG_6
NG6 was a Homo Erectus who lived in what is now Indonesia 50,000 - 27,000 years ago:
NG 6 is the fossilized upper cranium of the species Homo Erectus. It was discovered in Ngandong, Indonesia by C. ter Haar and GHR von Koenigswald in 1931-1933. Its characteristics include a slightly larger braincase than other Erectus samples and a fairly recent age of 50,000 - 27,000 years.
Last edited by Peterski; 12-06-2016 at 01:34 AM.
There are currently 1 users browsing this thread. (0 members and 1 guests)
 Posting Permissions

 Reply With Quote


Bookmarks