


1


| Thumbs Up |
| Received: 5,035 Given: 1,735 |
Dont be a racist.Originally Posted by Eskimo


| Thumbs Up |
| Received: 12,362 Given: 11,959 |
I dont pay that much attention to 23andme. I mean its great to analyze certain things but obviously its not perfectly representative when you are paying USD 100-300 to get tested. I used this tests for Cuban Americans and Argentina
| Thumbs Up |
| Received: 5,035 Given: 1,735 |
Bro, why are going loco on these guys? It ain't that serious to get all loco on them like that. If the Argentine guy has a 99% Euro DNA result, that's his result, he's white. No big deal. Why post an average when one third of those that were added to the sample could have been like him in the 90's? There are plenty of them here in TA on a thread. Also, I know 23andme has a good study, but why go loco about it if they didn't use it? It's not that serious, chacho.
Be cool, bro.
| Thumbs Up |
| Received: 5,035 Given: 1,735 |
Why is 23andme not representative? They have one of the most accurate personal tests around. If there are studies using 23andme data and method, I think it's fair to say it could be representative. If you chose to use different results from another study, that's fine. But if we are to get a small snap shot using the 23andme results we have here, why not take them seriously? They seem to be of the more accurate tests around.
| Thumbs Up |
| Received: 265 Given: 313 |
You should post more genetic studies about Mexicans using only samples from the north.. where no one lives.
| Thumbs Up |
| Received: 12,362 Given: 11,959 |
For comparison, my chilean boxplot vs a chilean study
http://www.nature.com/articles/ncomms7472
| Thumbs Up |
| Received: 12,362 Given: 11,959 |
Bro, i think the Cuban white % are not "fake numbers". Look at this
https://www.researchgate.net/publica...-control_study
Methods Setting and Study design
A one phase cross-sectional catchment area survey of allthose aged 65 years and over living in five catchmentareas in Ciudad Havana, Cuba (Lisa, Luyano, Marianao,Playa, and Plaza); and one catchment area in Matanzas(Milanes), a city 120 kilometres east from Havana, and anested case-control comparison of admixture.
According to interviewer perceptions, 1677 (72%) were considered to be 'white', while 394 (17%) were considered 'mixed' and 261 (11%) 'black'. For the case-control sub-sample (n = 584), the mean individual admixture proportions (after weighting back) were European 81.2% (95% confidence intervals 79.1-83.3%), African 16.2% (14.1-18.3%), and Native American 2.6% (2.3-3.0%). The mean African admixture proportion for the three ethnic groups was 5.8% (5.1-6.6%) for 'white', 28.6% (24.0-33.2%) for 'mixed' and 49.6% (44.8-55.4%) for 'black'. However, all three groups were substantially admixed with considerable overlap between the three ethnic identities, pure African or European ancestry being the exception (see Figure 1). A small proportion of those defined as 'white' had marked African ancestry and most of those defined as 'black' had inherited much of their genome from European ancestors.
https://www.researchgate.net/publica...-control_study


| Thumbs Up |
| Received: 9,492 Given: 5,740 |
Do you know any good pca with all south America? I ve seen a few bad ones with only a few countries.
| Thumbs Up |
| Received: 12,362 Given: 11,959 |
You mean something like this?
http://journals.plos.org/plosone/art...l.pone.0034695
1st and 2nd Multidimensional components of samples from the cities of Buenos Aires, Mexico and San Juan, including European, African and Indigenous American ancestrals (black triangles). Samples from Buenos Aires are in gold, samples from Mexico are in light blue and samples from Puerto Rico are in purple.

| Thumbs Up |
| Received: 12,362 Given: 11,959 |
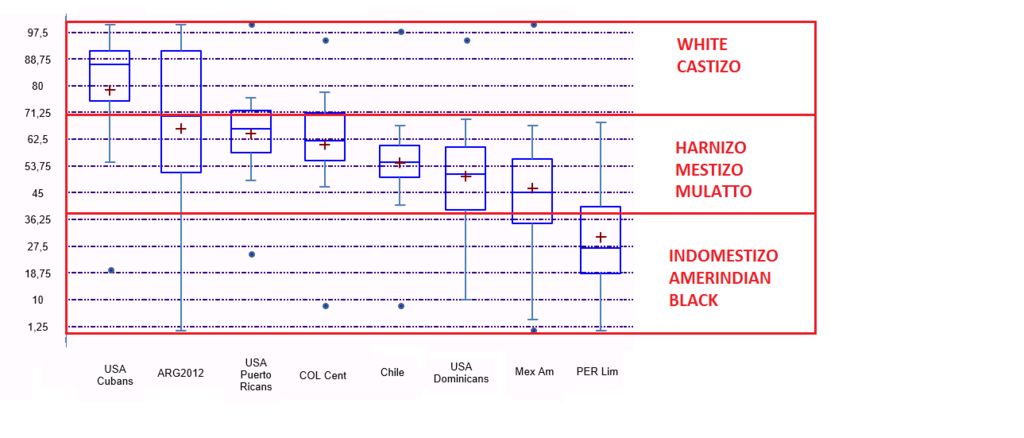
The problem with latin america is that we are so diverse, and there is millons of us. Lets say you make a study with 1000 samples in Salvador de Bahia. The result will be mulatto. Then you make one in south Brazil. The result is Castizo. Then you make one in Coastal Colombia. The result is Black. Then you make one in Paisa region in Colombia. The result is Harnizo.
You have to take A LOT of samples, tests A LOT of regions and take into account the importance of each region.
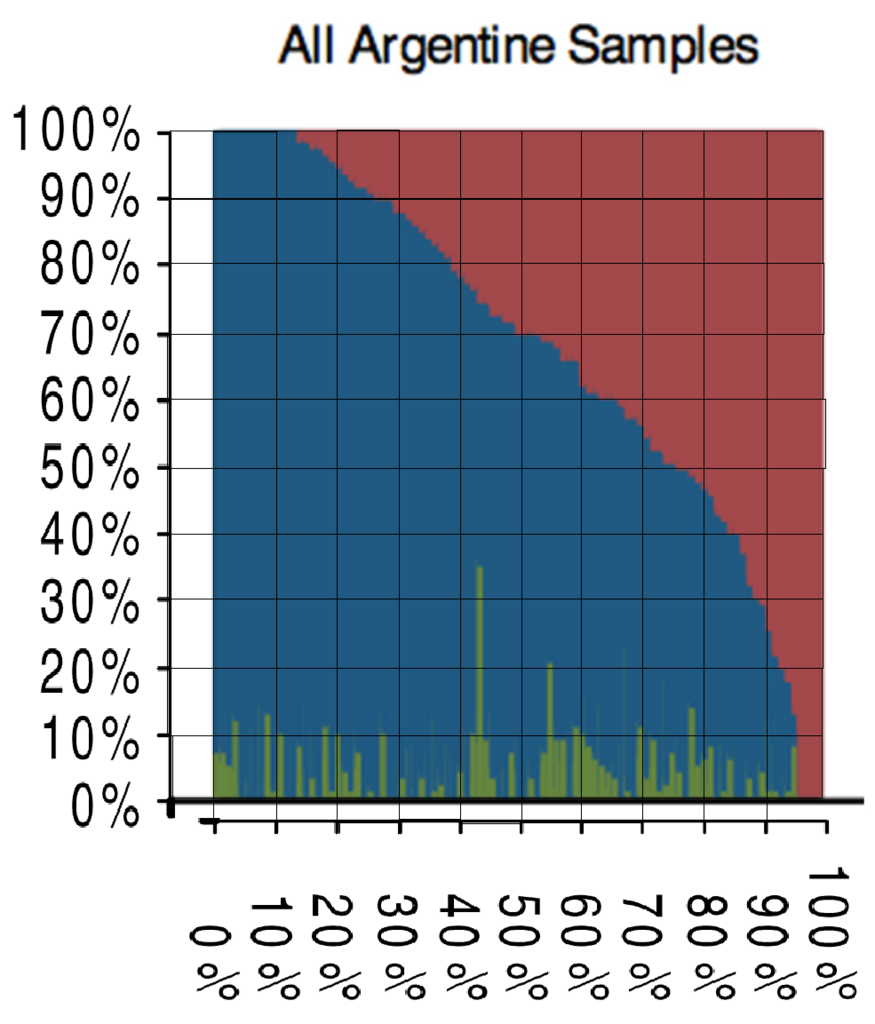
For example you can take 200 samples of Salta and you will reach the conclusion that Argentina is like Bolivia. But Salta only has 3% of the Argentine population. Making studies in latin america is VERY HARD thats why i prefer to make my own boxplots with the studies i find reasonable. I doubt we will see 1 study with several countries, several regions, several social classes being tested and thats the only way to reach a reasonable result.
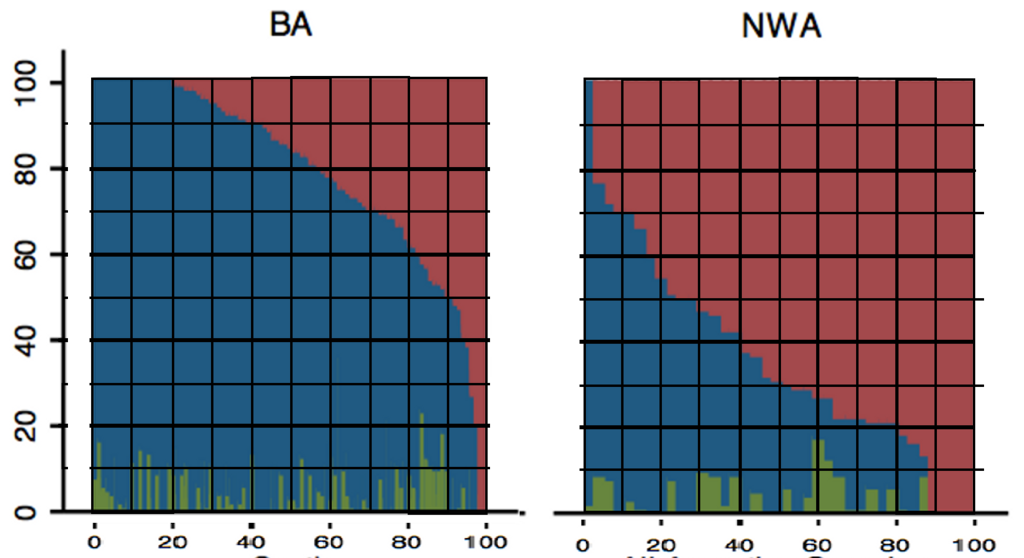
This is all from Argentina. Biuenos Aires (50% of the population) in central region and Salta (3% of the population) in the northwest. Its like 2 different countries.
There are currently 1 users browsing this thread. (0 members and 1 guests)
 Latin America
Latin America
Latin America
Latin America
Latin America
Latin America
Latin America
Latin America
Latin America
 Posting Permissions

 Reply With Quote


Bookmarks