

0


| Thumbs Up |
| Received: 7 Given: 0 |
Found at Dienekes Anthropology Blog:
June 24, 2010
Population structure in Ireland and Britain (O'Dushlaine et al. 2010)
From the paper:
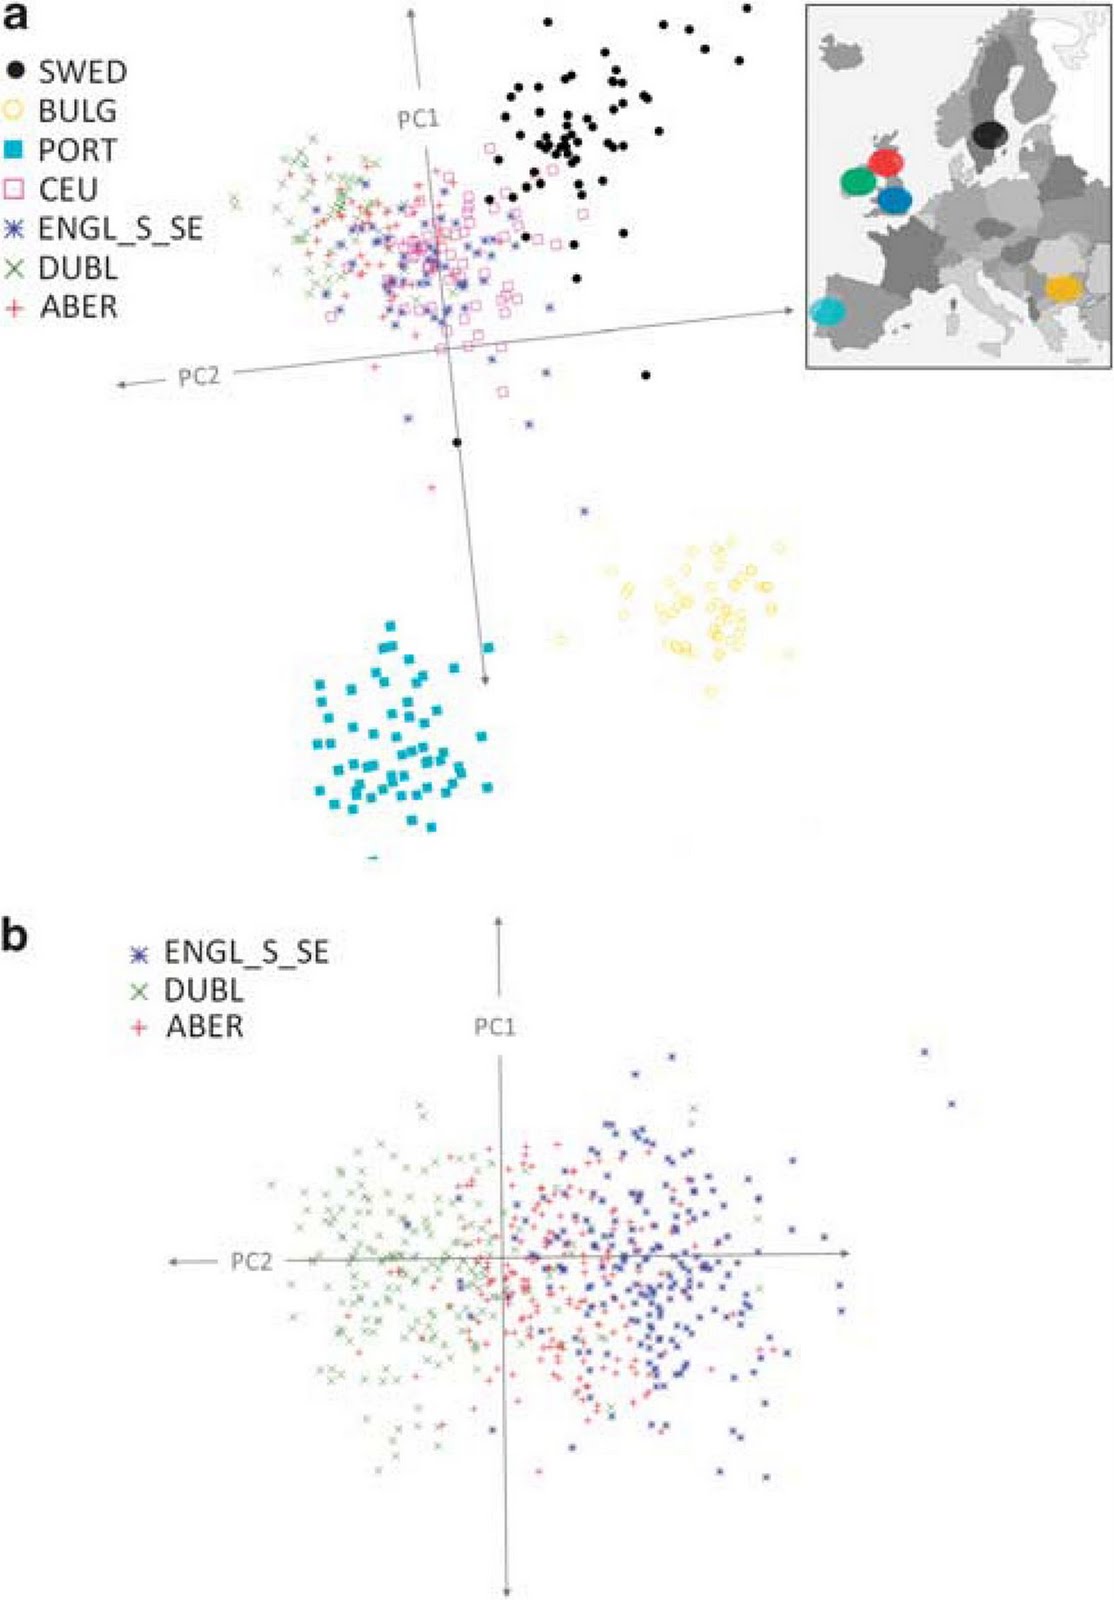
Eigensoft PCA analysis across all seven of our European and European-ancestry populations broadly identified four sub-groups consisting of (i) Bulgarian, (ii) Portuguese, (iii) Swedish and (iv) Irish/British/Utah populations (see Figure 1a, Supplementary Figure S1). The first two principal components (PCs) separate out northern from southern, and western from eastern European ancestry, respectively. The Europe-wide PCA analysis positions the Scottish population (Aberdeen) intermediate between the Irish and English populations. We further explored this observation by restricting our PC analysis to residents of Ireland, Scotland (Aberdeen) and south/southeast England (Figure 1b, Supplementary Figure S1). This analysis confirms the observation that the Scottish population is intermediate between the Irish and English cohorts on the first principal component(this time dividing west from east). Although more subtle, the Scottish cohort is also shifted slightly from the other two on PC2.The distinction between Britons and Swedes was also noted in an earlier study. It's nice to see Bulgarians and Portuguese sampled, as they have been rather neglected in genomic studies, but, unfortunately none of their neighbors or any other intermediate populations were included, which is understandable as the study focused on British Isles populations. Bulgarians and Portuguese served as "anchor points" to re-create the well-known correlation of the first two PCs of European genetic variation with longitude/latitude.
The intermediate position of Scottish populations relative to the Irish and English is not surprising, given the Gaelic connection between Scotland and Ireland.
The paper also has haplotype diversity data that can be compared with those recently published by Auton et al.
The authors observe:
In summary, our results illustrate a subtle genetic structure across Britain and Ireland in the context of the comparatively homogenous nature of the European genetic pool. We have observed slightly elevated levels of LD and genome-wide homozygosity in Ireland and Sweden compared with neighbouring British and European populations, although these levels do not approach those of traditional population isolates. Similarly, we have illustrated a decrease in HD in Britain and Ireland, more so in Scotland and Ireland than in England.Finally, the authors present results of frappe analysis (Figure S2):
At K=2 we see a distinction between northern and southern Europeans.
At K=3 a distinction between British Isles and Sweden appears. The absence of the Western European component in Bulgarians is noteworthy and expected.
At K=4 the Bulgarian component is identified.
At K=5 a Portuguese component is identified.
British Isles populations are dominated by the "Northwestern" green component with variable "Scandinavian" white (which is higher in England as expected) and both "Iberian" and "Balkan" minority elements.
European Journal of Human Genetics doi: 10.1038/ejhg.2010.87
Population structure and genome-wide patterns of variation in Ireland and Britain
Colm T O'Dushlaine et al.
Abstract
Located off the northwestern coast of the European mainland, Britain and Ireland were among the last regions of Europe to be colonized by modern humans after the last glacial maximum. Further, the geographical location of Britain, and in particular of Ireland, is such that the impact of historical migration has been minimal. Genetic diversity studies applying the Y chromosome and mitochondrial systems have indicated reduced diversity and an increased population structure across Britain and Ireland relative to the European mainland. Such characteristics would have implications for genetic mapping studies of complex disease. We set out to further our understanding of the genetic architecture of the region from the perspective of (i) population structure, (ii) linkage disequilibrium (LD), (iii) homozygosity and (iv) haplotype diversity (HD). Analysis was conducted on 3654 individuals from Ireland, Britain (with regional sampling in Scotland), Bulgaria, Portugal, Sweden and the Utah HapMap collection. Our results indicate a subtle but clear genetic structure across Britain and Ireland, although levels of structure were reduced in comparison with average cross-European structure. We observed slightly elevated levels of LD and homozygosity in the Irish population compared with neighbouring European populations. We also report on a cline of HD across Europe with greatest levels in southern populations and lowest levels in Ireland and Scotland. These results are consistent with our understanding of the population history of Europe and promote Ireland and Scotland as relatively homogenous resources for genetic mapping of rare variants.
Link


| Thumbs Up |
| Received: 364 Given: 0 |
I'm really looking forward to the major overviews which unite the different studies and data to give us an even more complete picture of European and general human racial-population variation.
What I found particularly interesting here is that Sweden has huge individual differences if it's about the Southern European component. F.e. while it's generally low, its above 50 percent in at least two individuals.
In another study, also published at Dienekes' site too, even the distinction of villages was made possible.
I think we getting slowly but steadily closer and closer to the genetic differences which are of a broader phenotypical-adaptive importance on an individual base and a quantitative population analysis for those too, which is the most important and interesting issue.

| Thumbs Up |
| Received: 100 Given: 0 |
Thanks Zyklop! We don't see many studies on the UK, so this is good stuff!
There are currently 1 users browsing this thread. (0 members and 1 guests)
 Posting Permissions


 Reply With Quote
Bookmarks