


 Latin America
1


| Thumbs Up |
| Received: 6,171 Given: 7,123 |
this bar plot makes a lot of sense for Brazilian reality. Interesting how the self-reported white person can be as low as 60something % european, and the self declared black can be less than 50% African, but It's the nude, crude, truth.Originally Posted by Argentano

I, meself, even fall in this chart.
All around me are familiar faces, worn out places, worn out faces
Bright and early for the daily races, going nowhere, going nowhere


| Thumbs Up |
| Received: 12,362 Given: 11,959 |
| Thumbs Up |
| Received: 12,362 Given: 11,959 |
SAO PAULO 2018
Extended HLA-G genetic diversity and ancestry composition in a
Brazilian admixed population sample: implications for HLA-G
transcriptional control and for case-control association studies
https://www.ncbi.nlm.nih.gov/pubmed/30107212
2.1 Population Sample
This study was approved in its ethical aspects by the “Comitê de Ética em
Pesquisa” of Faculdade de Filosofia, Ciências e Letras de Ribeirão Preto, FFCLRP-USP
(process n.25696413.7.0000.5407).
A total of 335 healthy volunteers from Ribeirão Preto city area, located at the
Northern region of the State of São Paulo, Southeastern Brazil, were enrolled at the
Hemocentro de Ribeirão Preto (Ribeirão Preto Medical School, FMRP-USP). These
individuals, 165 women and 170 men, with ages ranging between 18 and 70 years,
filled a questionnaire, signed an informed consent term and donated a 10 mL blood
sample.
A subgroup of 108 individuals of the current sample was also included in a
previous study addressing HLA-G variability using a different library preparation
procedure [20], which did not include the segment upstream position -1406.
Average ancestry proportions from a given population sample can be easily
retrieved from a small set of genetic markers. The ancestry composition of this sample
was evaluated using the SNPforID 34-plex system, showing 82%, 14% and 4% of
European, African and Amerindian/Asian contribution, respectively. These results are
in agreement with previous findings involving Brazilian urban populations [59-61].
Moreover, they corroborate the historical data regarding the colonization in
Southeastern Brazil
Ribeirao Preto City Ethnicity
Source: Census 2000
Ethnic groups Percent
White 76.9%
Black 5.6%
Pardo (Brown) 15.7%
Asian 0.8%
Amerindian 0.1%
https://en.wikipedia.org/wiki/Ribeir...eto#Demography
| Thumbs Up |
| Received: 12,362 Given: 11,959 |
COLOMBIA
https://www.biorxiv.org/content/bior...94726.full.pdf
Study population
We enrolled 441 mestizo adult men and women, living in the cities of Bogota, Medellin,
Cali, Barranquilla and Bucaramanga (Colombia, South America) between July and November
2014.
We characterized the ancestral genetic composition in 440 of these participants using a
panel of 40 ancestry informative markers (AIMs) that have been previously shown to
discriminate among European, Native American and African populations
Overall, the ancestral genetic composition of the individuals of this cohort was (mean ±
SD) 0.674 ± 0.057 European (range: 0.4690.788); 0.209 ± 0.048 Native American (0.089
0.397); and 0.117 ± 0.047 African (0.0510.352) (Figure 1A)
Barplot and boxplots in the link
| Thumbs Up |
| Received: 12,362 Given: 11,959 |
Sao Paulo
https://openheart.bmj.com/content/op...00434.full.pdf
Patients self-reported as white presented an average of 80% European ancestry, 12% of African ancestry and 8% of Amerindian ancestry.
Among self-declared brown patients, genetic ancestry was 58% European, 31% African and 11% Amerindian.
Self-declared blackpatients had on average 32% European ancestry, 61% African ancestry and 7% Amerindian ancestry
| Thumbs Up |
| Received: 12,362 Given: 11,959 |
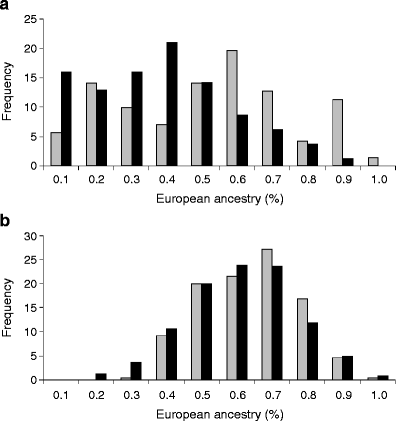
Mexico and Colombia
https://link.springer.com/article/10...125-009-1412-x
Fig. 1
Histograms of European ancestry proportions in type 2 diabetes participants and controls from Mexico (a) and Colombia (b), using 67 AIMs. Black bars, type 2 diabetes; grey bars, controls
Overall, the proportion of European ancestry is estimated to be 33% in diabetic participants vs 46% in controls in Mexicans, and 56% vs 59% respectively in Colombians.
| Thumbs Up |
| Received: 12,362 Given: 11,959 |
Hispanics
http://ng.neurology.org/content/3/5/e185
Methods: Using 6.8 million single nucleotide polymorphisms (SNPs), we conducted a genome-wide association study (GWAS) to identify SNPs associated with WMH volume (WMHV) in 922 Hispanics who underwent brain MRI as a cross-section of 2 community-based cohorts in the Northern Manhattan Study and the Washington Heights–Inwood Columbia Aging Project. Multiple linear modeling with PLINK was performed to examine the additive genetic effects on ln(WMHV) after controlling for age, sex, total intracranial volume, and principal components of ancestry. Gene-based tests of association were performed using VEGAS. Replication was performed in independent samples of Europeans, African Americans, and Asians.
RESULTS
The sample characteristics of the NOMAS and WHICAP Hispanic MRI cohorts are presented in table 1. Among the 922 Hispanic participants overall, the mean age was 71.1 ± 9.0 years, and 63.7% were women. Compared with NOMAS Hispanic participants, WHICAP Hispanic participants had a greater WMH volume (WMHV) and smaller intracranial volumes because of the older age distribution. The population substructure of each of the NOMAS and WHICAP Hispanic MRI cohorts is presented in figure 1. The overall cohort was on average 57% European, 31% African, and 12% Native American, expected, given the largely Dominican Hispanic population of Northern Manhattan.

| Thumbs Up |
| Received: 12,362 Given: 11,959 |
Paraguay YDNA
https://www.fsigenetics.com/article/...259-X/fulltext
The aim of this study was to characterize 23 Y-STR markers in a
sample from Paraguay, since no data is yet available for Y chromosome
specific markers in this population. Therefore, blood samples from 537
healthy unrelated males, living in 10 departments from the eastern
region of Paraguay (Supplementary Fig. S1B)
The results of this analysis revealed that Paraguay is closer to the
Europeans than to African or Native American populations. Paraguay
showed no significant differences with Argentina, Rio de Janeiro
(Brazil), São Paulo (Brazil) and Costa Rica, as well as with the Iberian
populations. Significant differences were found between Paraguay and
Bolivia, Ecuador, Peru and Panama, most probably due to the higher
Native American paternal ancestry of these populations, which were
closer to the Native populations (Supplementary Fig. S5).
| Thumbs Up |
| Received: 12,362 Given: 11,959 |
SAO PAULO 2018
http://www.g3journal.org/content/ear.../g3.118.200650
https://figshare.com/articles/Supple...l_2018/7040102
This study included 939 samples to represent the parental groups that contributed to the formation of the Brazilian population and 1050 individuals from the admixed population of São Paulo state, Brazil.
The samples considered as parental groups included: African, European, Native American, and Japanese. To validate the AIM set usage for estimating Asian ancestry, we employed it in the analyses of 1050 individuals from São Paulo state, in Southeastern Brazil. This population was formed by the admixture of European (higher contribution), African and Native American populations, as well as, more recently, by a significant amount of Japanese individuals. Therefore, the São Paulo population is suitable to be analyzed in this study.
All participants have authorized the collection of their biological samples by signing a consent form and the ethical aspects of this study have been approved by the Ethics Committee (Santos et al. 2010).


| Thumbs Up |
| Received: 2,495 Given: 884 |
More asian than native at all in SP. Plausible.
Makes sense, too. Although you'll have some "whites" at 60% range and some pardos at 80% range. Skin colour is far more important at all in Brazil.
There are currently 1 users browsing this thread. (0 members and 1 guests)
 Posting Permissions


 Reply With Quote


Bookmarks