


 Latin America
0


| Thumbs Up |
| Received: 2,702 Given: 85 |
Vitiligo is not a good way to measure genetics because it affects more people with african ancestry, blacks have a higher incidence. So the results can appear less euro and more african.Originally Posted by Argentano

| Thumbs Up |
| Received: 2,702 Given: 85 |
83% Euro seems accurate for Sao Paulo countryside cities. Sao Paulo outside Sao Paulo multicultural rainbow metropolis is a very european area at South Brazil level.
| Thumbs Up |
| Received: 2,702 Given: 85 |
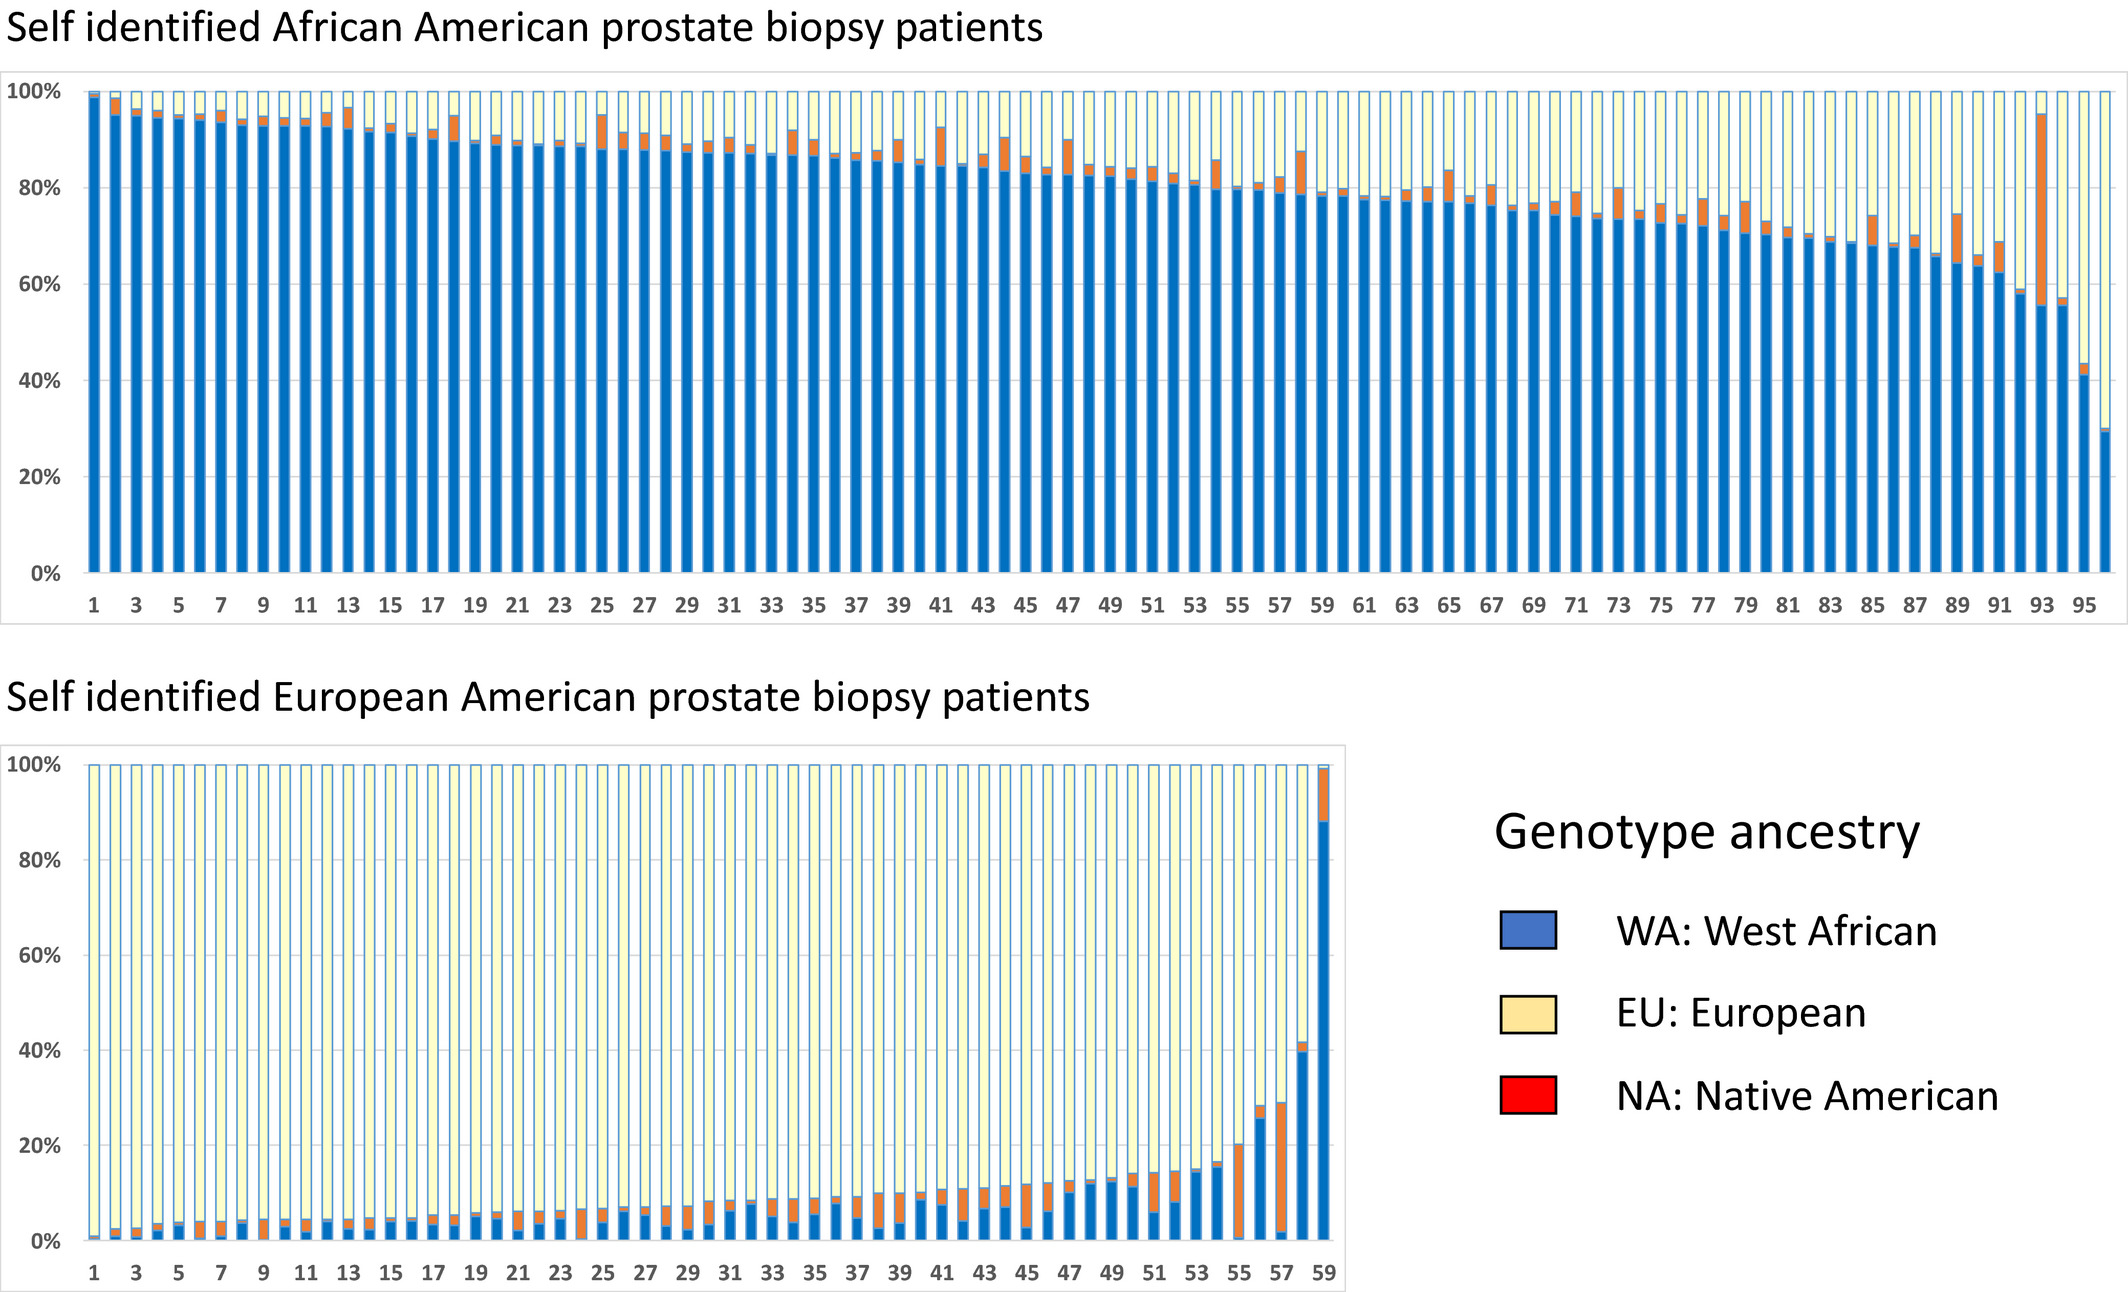
So according to this study black americans are 85% african and white americans 94% european on average?
| Thumbs Up |
| Received: 2,702 Given: 85 |
According to this study Brazil seems 67.5%-70% euro again, like many others before. Seems very plausible.


| Thumbs Up |
| Received: 12,363 Given: 11,959 |
Look again
notice i only highglighted the CONTROL GROUP that is the random group that doesent have Vitiligo.
| Thumbs Up |
| Received: 2,702 Given: 85 |
True! You are right.
| Thumbs Up |
| Received: 12,363 Given: 11,959 |
BRAZIL SAO PAULO
https://www.nature.com/articles/s41598-019-50362-2#Abs1
Methods
Subjects
We analysed 264 healthy individuals (159 females; 105 males) ascertained at the University of Campinas hospital (UNICAMP, Campinas, São Paulo, Brazil) within the scope of the Brazilian Initiative on Precision Medicine Project (BIPMed; http://bipmed.org). We defined them as the Brazilian-São Paulo sample (BRS). Among them, 202 had information about their state of birth (Supplementary Fig. 27). This study was approved by the Research Ethics Committee of the University of Campinas (UNICAMP, Campinas, São Paulo, Brazil), and we obtained informed consent from all participants who signed a consent form before entering the study. All methods were performed in accordance with the relevant guidelines and regulations.
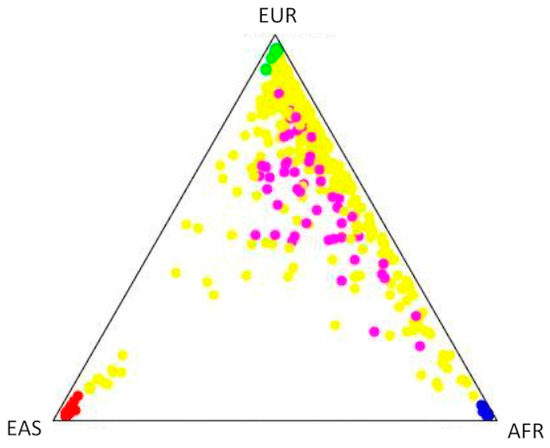
In order to avoid an excess of subpopulation variation in global and local ancestry comparison, we focused on global ancestry inference at K = 5, which identified the ancestry components from the five continental populations presented in the 1 KGP data (Fig. 1b, Supplementary Fig. 3). The BRS sample showed a high ancestry proportion of the European component (blue; mean = 76.9%; SD = 15.7%), followed by sub-Saharan African (red; mean = 13.8%; SD = 11.6%) and Native-American (green; mean = 7%; SD = 5.6%) components (Supplementary Table 1), which is consistent with previous studies19,20. We also observed that five individuals located between the European and East Asian clusters in PCA had an East Asian component in the admixture plots (Supplementary Fig. 3). Indeed, after this observation, we were able to retrieve some of the surnames of the volunteers, and four of them bore Japanese surnames.
ordered from least euro to most euro. Blue is euro, orange is african green is amerindian and yellow is asian.


| Thumbs Up |
| Received: 5,529 Given: 1,986 |
Deleted.
Last edited by Catarinense1998; 10-08-2019 at 10:26 PM.


| Thumbs Up |
| Received: 2,306 Given: 1,198 |
It has been posted, this one is very outdated now.
| Thumbs Up |
| Received: 12,363 Given: 11,959 |
https://www.ncbi.nlm.nih.gov/pmc/articles/PMC6748312/
METHODS:
This is a multicenter, observational, cross-sectional study with 1564 patients, conducted between August 2011 and August 2014 in 14 public clinics from 10 Brazilian cities. The ethnic aspects of the patients were evaluated using self-reported color-race and genomic ancestry (divided in European, African, and Amerindian). We divided the patients into groups: normal renal function and CKD.
The median EUR ancestry in our sample was 68.0 [30.9], AFR was 16.3 [23.1] and NAM was 10.2 [15.9]. Figure 1 shows the global admixture distribution per individual considering the proportion of EUR, AFR and NAM ancestries and dividing the patients into normal renal function group and CKD group.

There are currently 1 users browsing this thread. (0 members and 1 guests)
 Posting Permissions

 Reply With Quote
Bookmarks