


 Latin America
0


| Thumbs Up |
| Received: 14,915 Given: 27,872 |
Genial!!Originally Posted by Javier85

Ahí voy a participar.

| Thumbs Up |
| Received: 1 Given: 0 |
What would you classify this puerto rican as? I'd say harnizo but you be the judge Screenshot_20191220-171912_Facebook.jpg
| Thumbs Up |
| Received: 1 Given: 0 |
..


| Thumbs Up |
| Received: 12,362 Given: 11,959 |
NEW 2020 Mexican genetic study
https://www.mdpi.com/2073-4425/11/1/114/htm
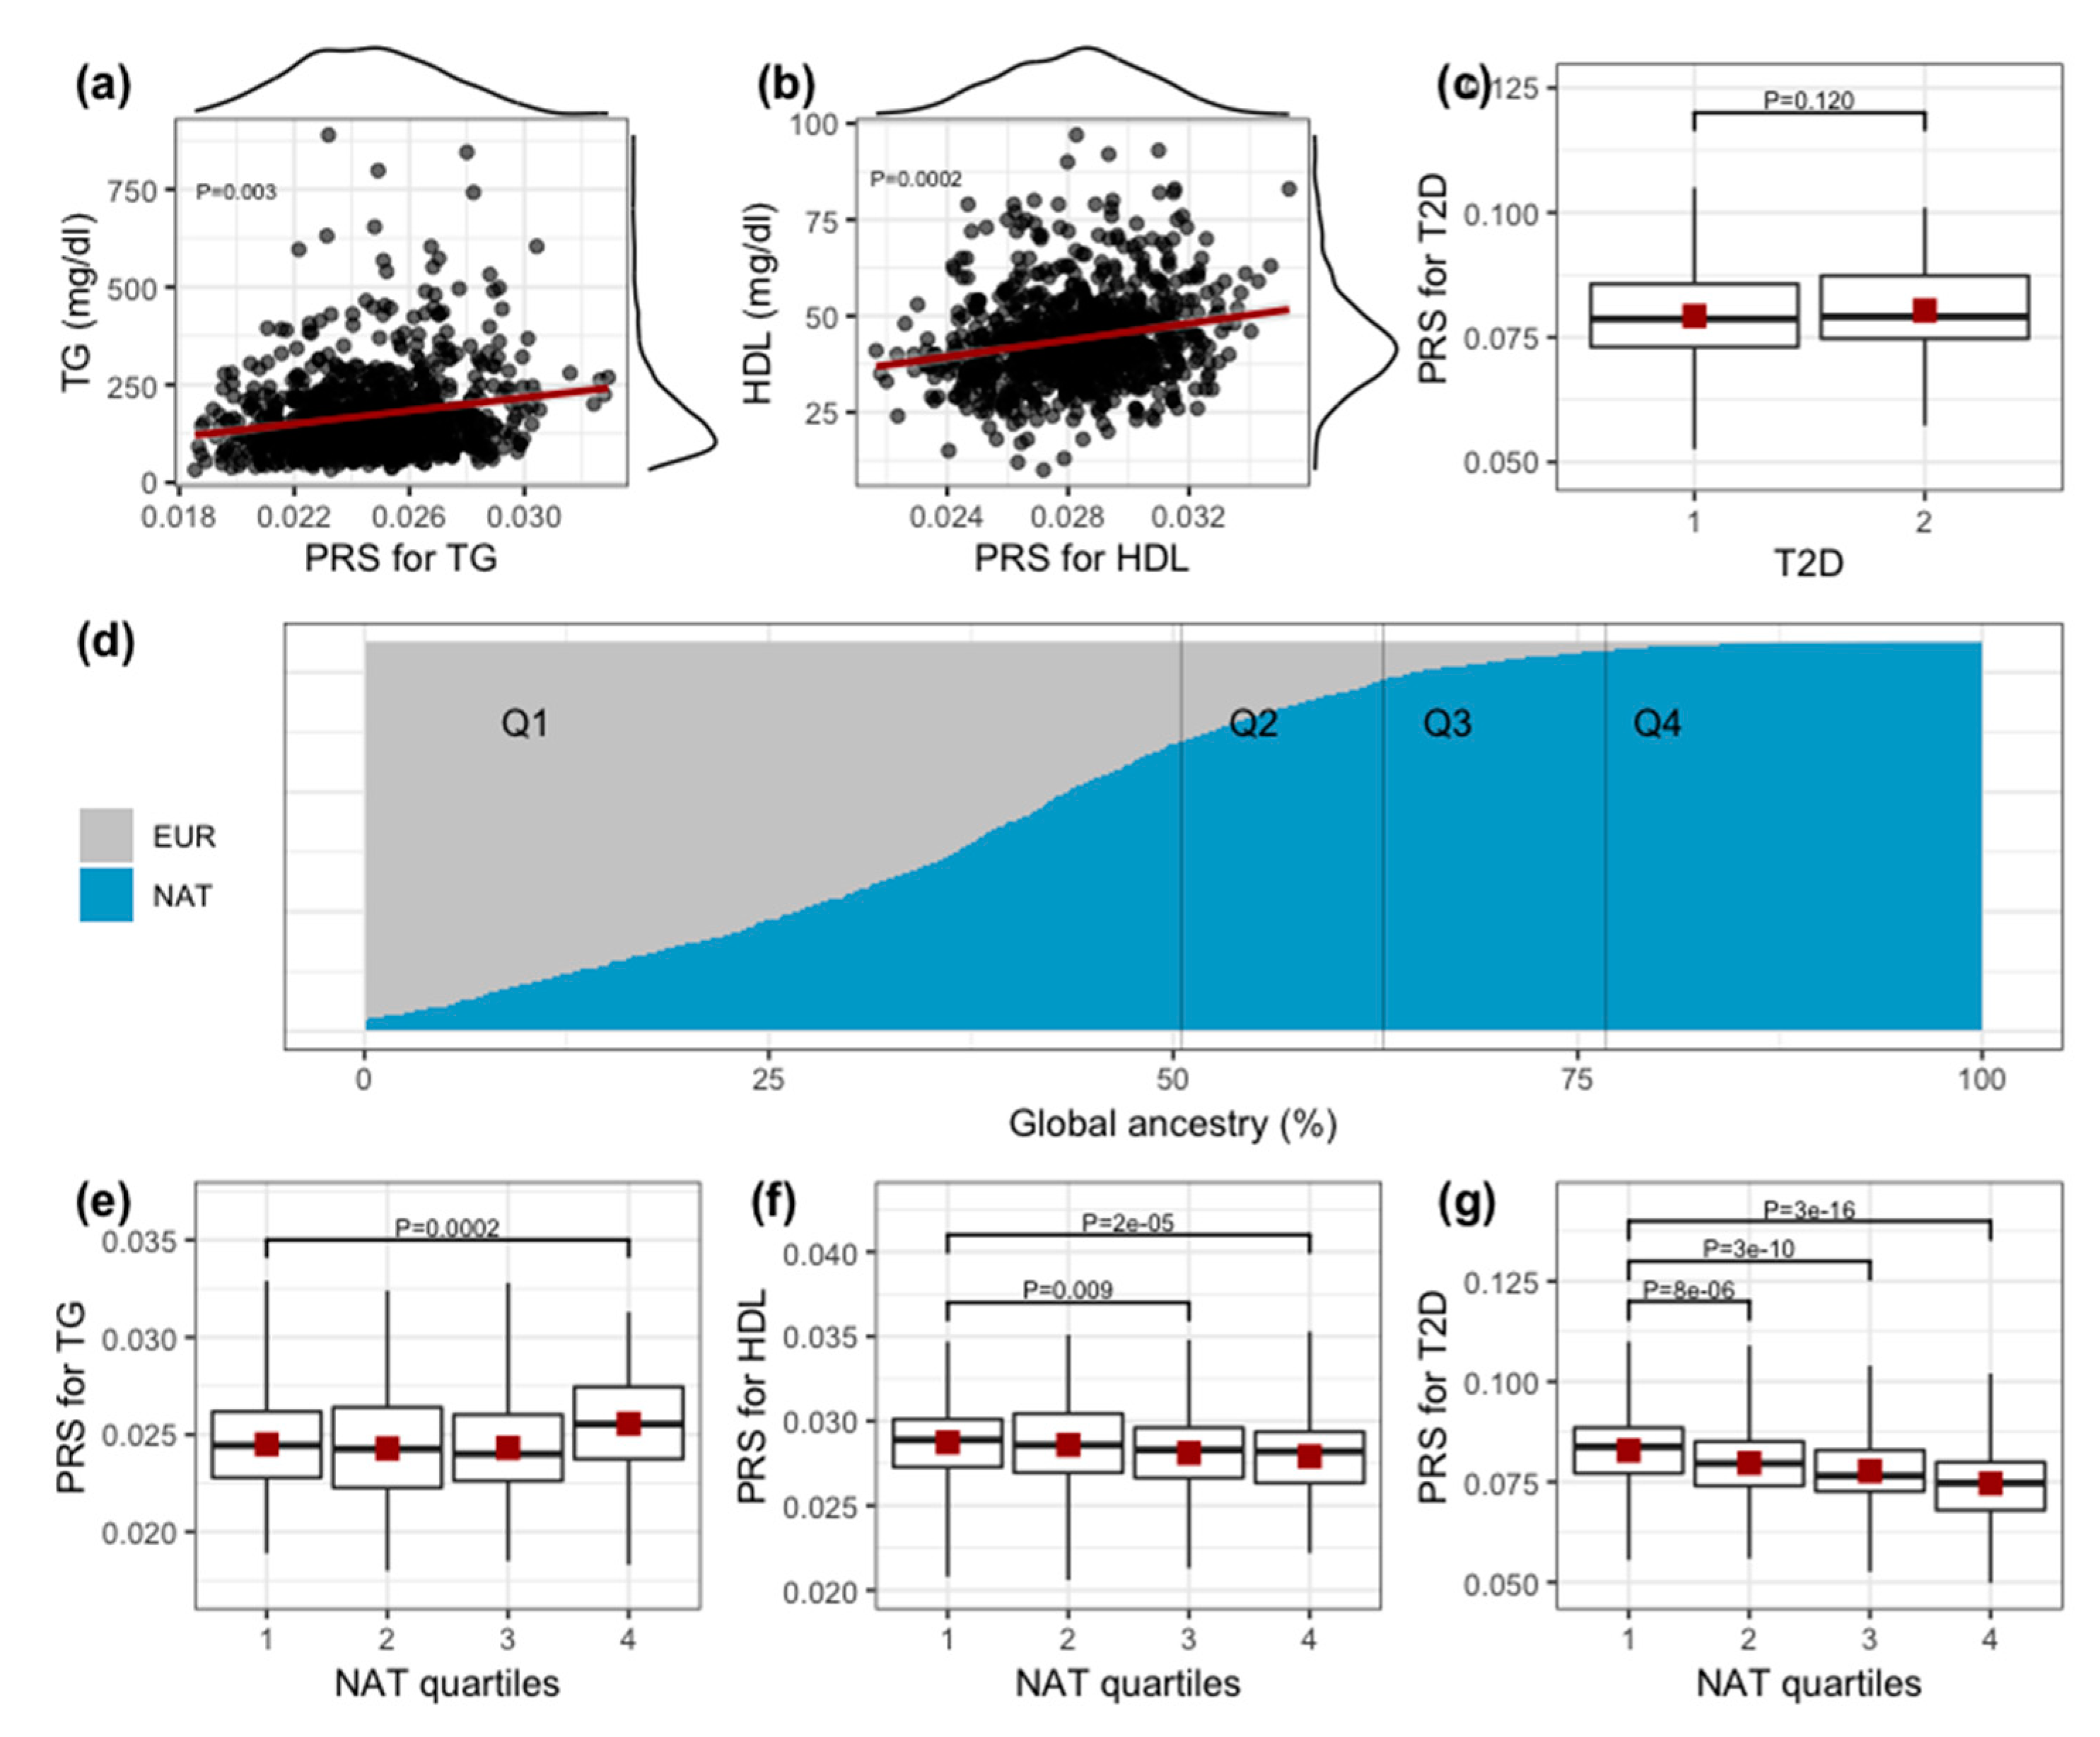
Contribution of Known Genetic Risk Variants to Dyslipidemias and Type 2 Diabetes in Mexico: A Population-Based Nationwide Study
Received: 16 November 2019 / Accepted: 11 January 2020 / Published: 20 January 2020
3. Results
Sample included 1627 individuals across all country. Eligible samples had complete questionnaires, serum samples, and DNA. On average, subjects were 35.2 ± 14 years old and both men and women groups were equally represented. Based on the individual expansion weights from the NHS-2000, they represented 1,920,663 Mexican adults (3.6% of the 52,850,503 Mexican adult population 20 years or older in the year 2000) (Table 1). All states of Mexico were represented (Figure 1).
When analyzing the global ancestry proportions, we found that the individuals born in the northern region of Mexico showed lower Native American ancestry proportions, as compared to the individuals born in the rest of the country (survey t test, p < 0.001). In this study, the Native American ancestry proportions of the four geographic regions of Mexico were: North region 52.8%, Center region 58.6%, Mexico City region 63.3% and South region 79.9% (Figure 1).
Figure 1. Sample size representation across states of Mexico. Pie plots show the global ancestry proportions for each of the four geographic regions of Mexico.
(d) shows the individual global ancestry proportion of the studied sample. It was calculated from the two main parental populations of Mexicans, namely European and Native American ancestries.
European Grey native american blue
| Thumbs Up |
| Received: 12,362 Given: 11,959 |
this is another NEW 2020 study now focused in Mexican Americans. What this other study shows is that recent mexican americans are more amerindian than older mexican americans.
https://www.biorxiv.org/content/10.1....905141v1.full
Recent fluctuations in Mexican American genomes have altered the genetic architecture of biomedical traits
Average Native american ancestry depending on decade of birth
RFMix inferred Native American global ancestry proportions plotted over time for HCHS/SOL Mexican Americans (n=3622).
Distributions of Native American global ancestry means for HCHS/SOL Mexican Americans (n=3622) generated by 1000 bootstrap resampling iterations within each decade of binned birth years.

He looks triracial to me. I've seen Dominicans with his phenotype.


| Thumbs Up |
| Received: 5,297 Given: 5,658 |
And Panamanians too
White > SSA > Amerindian
Yeap. And those Dominicans don't usually score more than 10%-15% native...


| Thumbs Up |
| Received: 2,022 Given: 2,705 |
I'm guessing he has higher NA than Puerto Rican average and SSA somewhere around 20%.
Hmm. I wouldn't call him an harnizo.


| Thumbs Up |
| Received: 2,779 Given: 208 |
Mexico is under study, much better than Brazil
There are currently 1 users browsing this thread. (0 members and 1 guests)
 Posting Permissions


 Reply With Quote
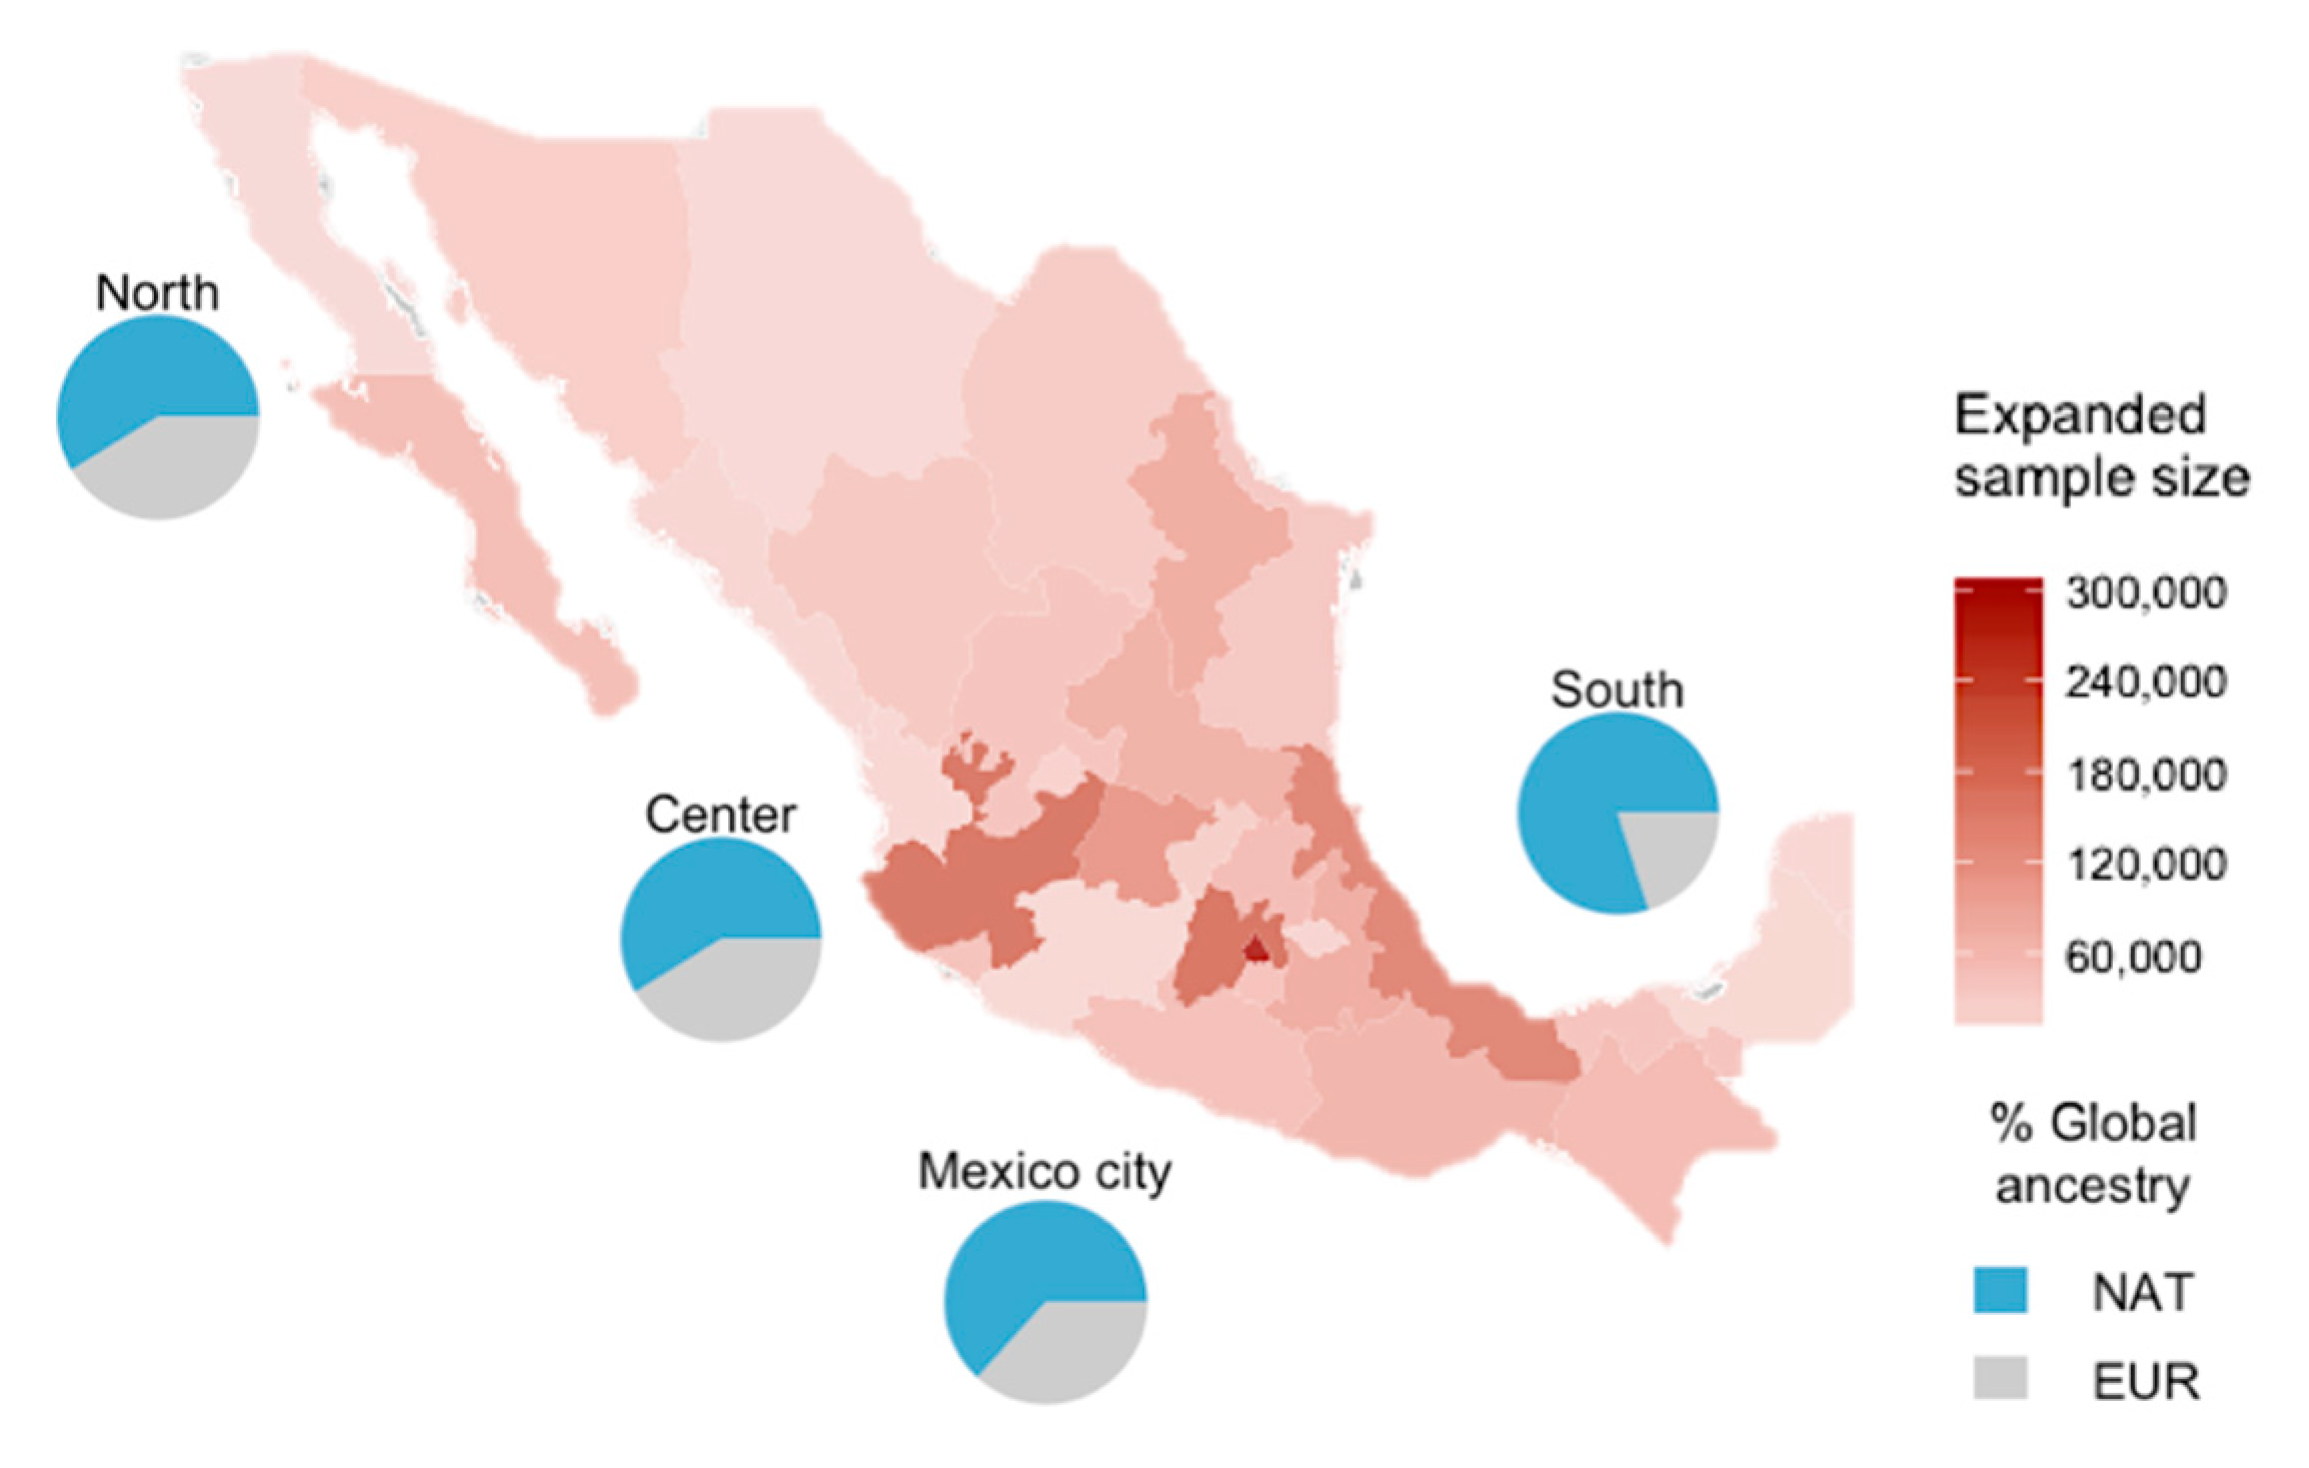

Bookmarks