

1


| Thumbs Up |
| Received: 4,663 Given: 2,177 |
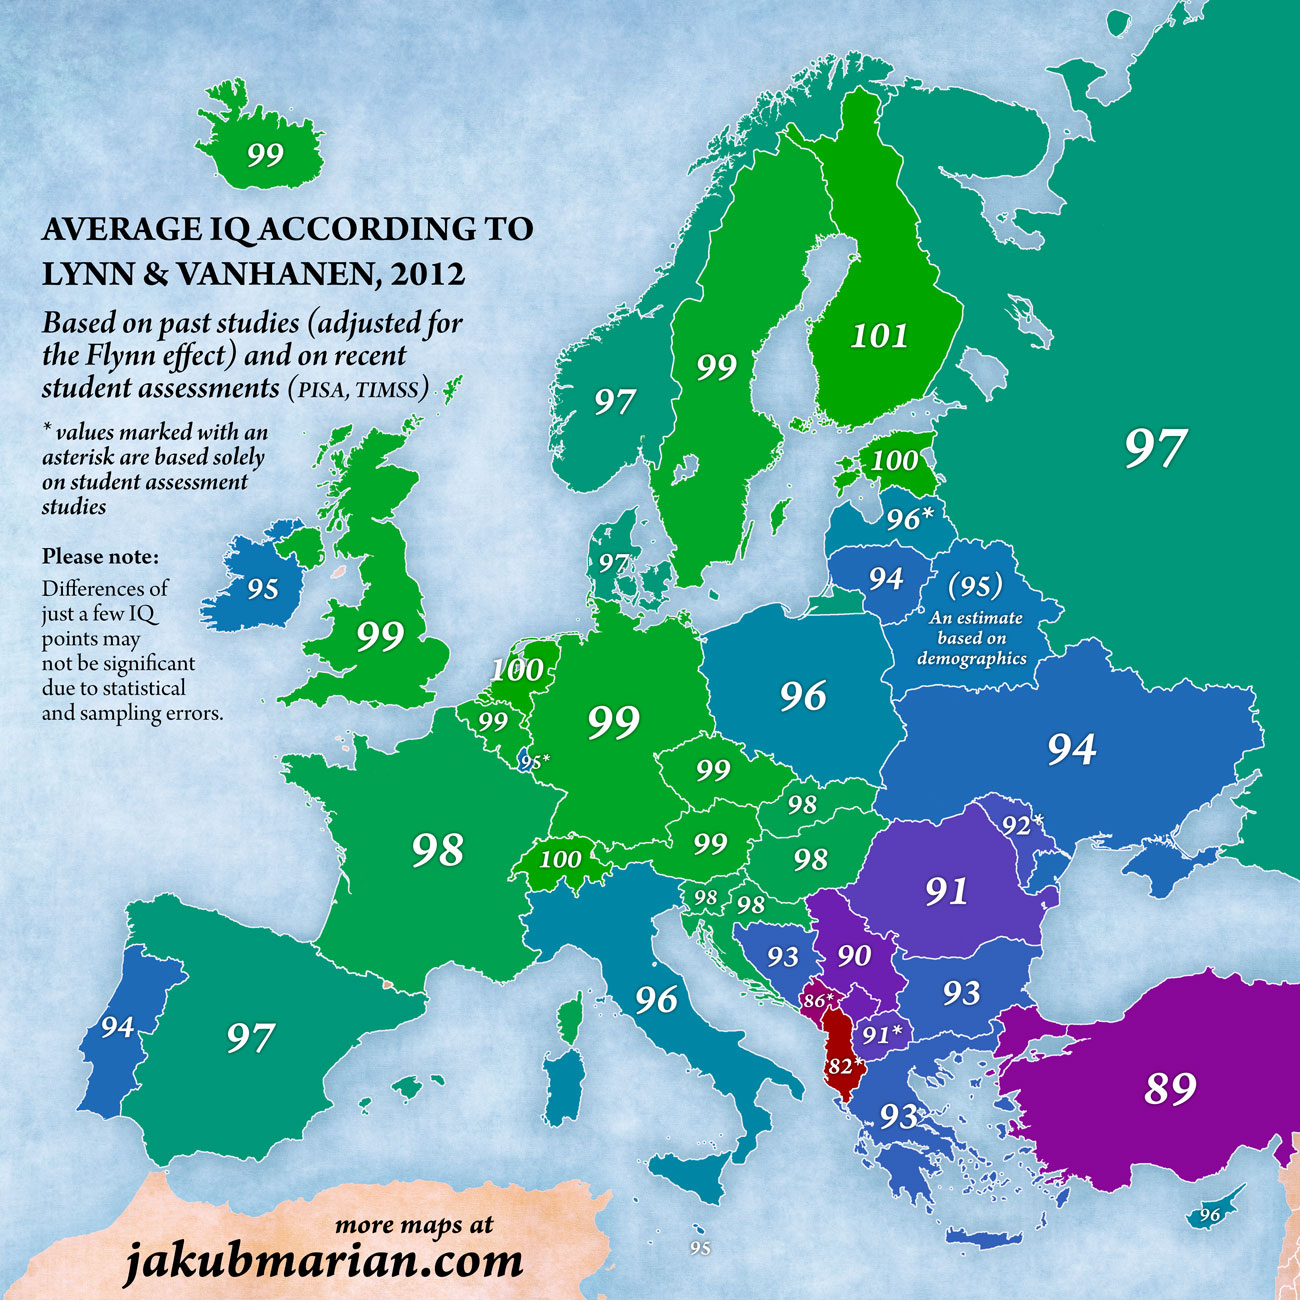
It is because he chose a map that speak positively for Spain ☺Originally Posted by Enflamme


| Thumbs Up |
| Received: 7,420 Given: 12,533 |
You say northern Euros have also psychological neoteny well, italians albanians and greeks live with their parents till age 65.
| Thumbs Up |
| Received: 2,152 Given: 2,395 |
Is this why Southern Europeans and Slavs tend to be stupider than Northern Europeans?

| Thumbs Up |
| Received: 5,960 Given: 9,127 |
They aren't.
https://www.forbes.com/2009/02/24/bo..._minority.htmlWhen statistical adjustments are used to convert the backward digit span results to full-scale IQ scores, Indian Americans place at about 112 on a bell-shaped IQ distribution, with white Americans at 100. 112 is the 79th percentile of the white distribution. For more context, consider that Ashkenazi Jews are a famously intelligent ethnic group, and their mean IQ is somewhere around 110.


| Thumbs Up |
| Received: 3,356 Given: 7,733 |
I can say the same thing for your mapBut, Lynn is not accurate, he's a nordicist, not neutral.
My IQ is 108, according to the raven test, yet I'm not a genius.

| Thumbs Up |
| Received: 52,721 Given: 43,621 |
Three Croats are in top 30 measured people with highest IQ, which makes 10% of the list, and we have population of 4 million.
http://superscholar.org/smartest-people-alive/
The Spanish member posted map which includes 1952 research of malnourished post ww2 Croatian children
http://www.theamericanconservative.c...iq-and-wealth/
Pathetic trolls.Croatians scored 90 in 1952...While the low scores of the Croatian children might be partly explained by malnutrition and other physical hardships experienced during the difficult years of World War II

| Thumbs Up |
| Received: 26,236 Given: 43,780 |
So looking childlike and incel is a way to guarantee higher intelligence and prosperity?
| Thumbs Up |
| Received: 5,960 Given: 9,127 |
These maps are often bullshits, some of those IQ scores are mere guesses based on neighbouring ethnicity's iq, economy etc rather than based on actual studies. PISA test scores are more reliable imo, they're more up to date and more standardized. I remember a while ago XenophobicPrussian posted a table that separated PISA test scores of natives from 1st generation, 2nd generation immigrants etc and best performing Europeans were South German, West German,Belgian and Swiss natives, not north Germans or Scandinavians.
| Thumbs Up |
| Received: 26,236 Given: 43,780 |
It is also funny how Europeans and East Asians are lumped together in this, when one reason why East Asian women are often attracted to White men is precisely because they look more robust and masculine than do most Asian men.


| Thumbs Up |
| Received: 11,269 Given: 13,631 |
They really are based on the actual studies, but that does not say much as I will tell you. What Lynn does is actually collecting those studies done over the years and done on particular nations. Then using his own methods he compares them to economy, PISA test scores and so on. Based on that he comes up with two IQ score: the one that is not adjusted to PISA score/economy and the one that is adjusted to PISA scores/economy. Obviously, the non-adjusted IQ score is the mean of those IQ studies he collected. What is criticized are his methods of getting the adjusted IQ. And the most importantly what IQ studies he chooses to include in his studies for comparison with PISA scores. In his 2012 study he surely added more references/actual studies compared to the 2002 study, but there are still more of them. Maybe he is aware of those he left out, maybe not. We can't know.
There are currently 1 users browsing this thread. (0 members and 1 guests)
 Posting Permissions


 Reply With Quote
Bookmarks