

1


| Thumbs Up |
| Received: 1,358 Given: 0 |
So what? there are other much more recent paper claiming SSA average for SOUTHERN IBERIANS as 1,41%±0,87, which one go against your agenda?Originally Posted by ecptr

Moreover, how can you prove the reliability of Wikipedia? stop with this obsession over my ancestors.
| Thumbs Up |
| Received: 1,358 Given: 0 |
Those NA scores in G25 seems to be a bit higher than average (10%±1,5%), are it 100% Taforalt?
About SSA, even the outlier portuguese member here doesnt score 5% SSA in any calculator, and this same study says Italians have 9,2% SSA lulz.
Last edited by Marshall Theodore; 02-27-2023 at 09:40 PM.


| Thumbs Up |
| Received: 3,420 Given: 4,234 |
The average was yep 10%, but at individual level if im not wrong was between 8% - 13% NA
The NA sample which i used its a Guanche average of oficial database, so its EEF admixed, not full IberoMaurisian
More Details about my Bahian & Portuguese ancestry:
Spoiler!
| Thumbs Up |
| Received: 3,420 Given: 4,234 |
U dont need trust in a "amateur" calculator like g25 (ik its not used in study bcs u can literally model with anythibg and have a overlap problem, but its good enough for simple models especially with averages models) i have some recents studies and with a profissional calculator:
https://www.ncbi.nlm.nih.gov/pmc/articles/PMC6436108/
Also a model made by a guy in Anthrogenica, with qpAdm and. . . .0% SSA. . .
https://anthrogenica.com/showthread....-WHG-etc/page4
More Details about my Bahian & Portuguese ancestry:
Spoiler!


| Thumbs Up |
| Received: 24,938 Given: 12,766 |
What other study supports 7.1% SSA ancestry anywhere in Iberia? None. Many people don't understand that a study only carries weight if its conclusion can be supported by other studies. Peer-reviewed only means it's acceptable to be published. It doesn't mean the conclusion is accurate.


| Thumbs Up |
| Received: 9,474 Given: 5,729 |
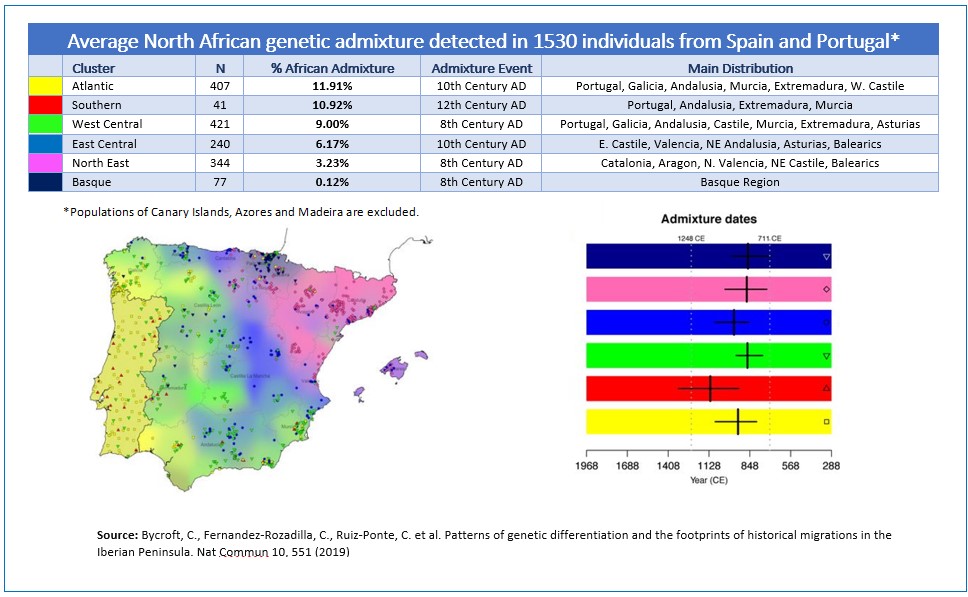
You guys are talking about different things i think. What they call African admixture is actually North African not SSA (of course), as labeled "% African admixture" on this figure below. These kind of values are pretty reasonable for NA and consistent with other studies, as well estimates in time of admixtures. Obviously the SSA is contained into the NA, it's not gonna show twice separetly in G25.
https://www.ncbi.nlm.nih.gov/pmc/articles/PMC3519480/
In the other study, they use f3 stats with AIMs "Ancestry Informative Markers" which are more highly differentiated sets of markers than with traditionally used snps. They tend to show more of SSA, or Asian for that matter. Italy appears more SSA because it's more CHG/Basal shifted which is closer (relatively) to SSA than any other components Europeans recieved. It show more deep relationships than admixture per say. Countries like Greece would probably show even more using this method.
While north Italy there s no notable SSA input, it might be even one of the lowest in Europe but it's still quite CHG like, this is the main reason it generally plots more southern on pca than Iberians. Even Germany and Ireland show a tiny bit of SSA with those markers, compared to Denmark or France. This also doesnt show Oceanian which may or may not be above noise level in certain Euro populations.
| Thumbs Up |
| Received: 3,420 Given: 4,234 |
The study seens good the % of NA looks accurate, but the date dont imo, the mix with NA started in Neolithic and become strong in Roman Era
More Details about my Bahian & Portuguese ancestry:
Spoiler!
| Thumbs Up |
| Received: 1,358 Given: 0 |
I think the date part its especulation.
There are currently 1 users browsing this thread. (0 members and 1 guests)
 Posting Permissions

 Reply With Quote


Bookmarks