


7


| Thumbs Up |
| Received: 12,362 Given: 11,959 |
http://www.annualreviews.org/doi/ful...3115-022331#f1
The Genetic Diversity of The Americas
This is NOT an actual genetic study, but a pretty good recopilation of the lastest studies.
Genetic Studies used
Estimated Genetic Ancestry
Percieved Genetic Ancestry vs Estimated Genetic Ancestry
Genetic ancestry depending on self percieved race

Last edited by Argentano; 09-16-2017 at 07:40 PM.
| Thumbs Up |
| Received: 12,362 Given: 11,959 |
I like this new compilation because it includes new studies with good amount of markers. The old studies tend to have weird incurate results.
Last edited by Argentano; 09-16-2017 at 06:24 PM.


| Thumbs Up |
| Received: 3,371 Given: 2,411 |
Damn,definitely one of the best compilations I've ever seen in TA!What surprised me the most was the fact that in Mulaló black colombians were only 46% SSA on average while in Choco the average is 84%,and that's pretty high considering that it is just an average and that there must have been people who were nearly full SSA in the sample.Also,it is interesting to note that in Santa Isabel do Rio Negro the average is almost as NA as the average of the Terenas,who are native american themselves.
| Thumbs Up |
| Received: 12,362 Given: 11,959 |
I would say this study is the best compliation that you can find. They include mostly recent studies with good amount of markers.Originally Posted by LESM

The only bad part i find is that they dont separate between private hospital samples and public hospital samples and the difference can be pretty significant in some countries like Argentina or Brazil.
Regarding brazil its also interesting to see that self repored whites are not the same in the north than in the south. And that USA blacks are much more african than Brazilian pretos.
| Thumbs Up |
| Received: 3,371 Given: 2,411 |
Not surprising since ''white'' is a really broad term in Brazil and the Southern share of the country recieved the overwhelming majority of recent immigrants.The results of white northerners surprised me though,usually northeasterners seem to be more european influenced and white colonials(by that I mean people who really can pass as fully european) seem to be more common in Northeast Brazil than in North Brazil.


| Thumbs Up |
| Received: 20,923 Given: 18,997 |
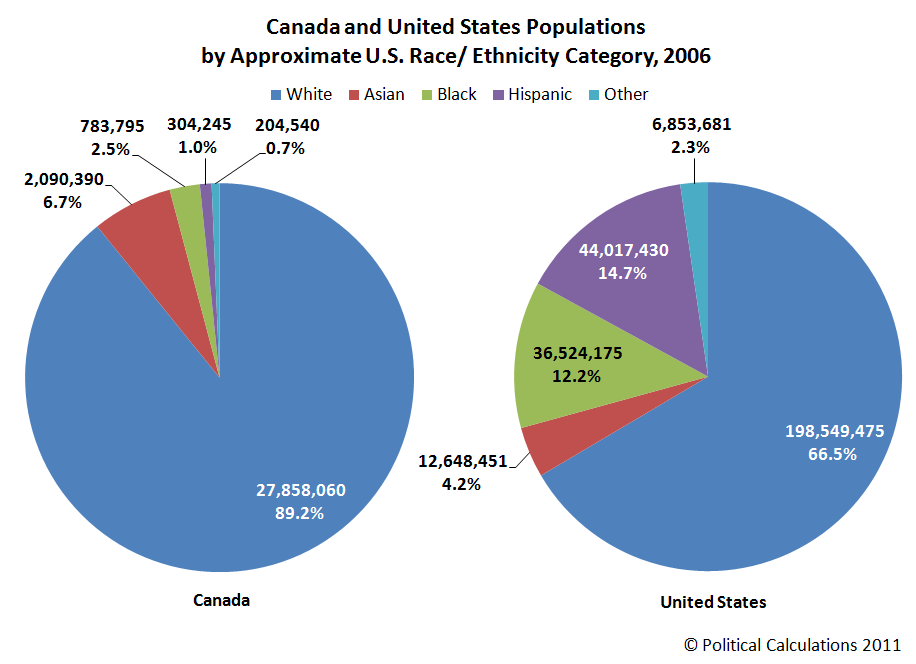
I'm surprised that the USA has more of Native ancestry than Canada.
BTW, here is breakdown of self-identified ancestry in the US in 2000:
https://www.theapricity.com/forum/sh...=1#post3557065
| Thumbs Up |
| Received: 12,362 Given: 11,959 |
Well the studies give you an idea, but are not absolute perfection. This shows that in Brazil northern whites are on average less euro than southern whites. Thats the conclusion i would reach.
The small difference between northern whites and northeastern whites could be different in another study. Dont take that small difference as 100% correct.
| Thumbs Up |
| Received: 12,362 Given: 11,959 |
why are you surprised? USA has a huge latino population plus a few native americans.
| Thumbs Up |
| Received: 20,923 Given: 18,997 |
About 4% of Canadians identify as First Nations, compared to 2% Native Americans in the US.
What about Latinos/Hispanics, how many Latinos are there in Canada compared to the USA?
Yes but Canada has them too, plus they have more of actual Amerindians, Inuits and Metis.
As for Latinos in the USA, I doubt that they are on average only 18% genetically Amerindian.
| Thumbs Up |
| Received: 12,362 Given: 11,959 |
There are currently 1 users browsing this thread. (0 members and 1 guests)
 Latin America
 Posting Permissions


 Reply With Quote
Bookmarks