

2


| Thumbs Up |
| Received: 1,628 Given: 1,115 |
Cavalli-Sforza separated Northern Chinese and Southern Chinese. N. Chinese was included in the East Asia cluster and S. Chinese in the Southeast Asia cluster.Originally Posted by michal3141

You can read it here:
https://books.google.lv/books?id=Frw...page&q&f=false
Pages 229-233: Genetics of East and Central Asia
Pages 234-236: Genetics of Southeast Asia
From his works:
Northern Chinese are in this tree, clustered together with Japanese:


| Thumbs Up |
| Received: 610 Given: 2,309 |
It would be great if we also have Kazakh, Kyrgyz, Altaian individuals in the spreadsheet so it can be determined how much Mongoloid they really are.
I believe that in a Global East Eurasia-West Eurasia-Africa PCA, Native Americans would plot close to the Kyrgyz and Altaian as they have similar amounts of Mongoloid and Caucasoid ancestry. For example this PCA seems to does a good job where Amerindians would plot among Old World Populations: Clovis, Pima are the Natives here. As you can see, they cluster somewhere between Kyrgyz and Altaians in the PCA.
And also this PCA: Totonacs are an Amerindian ethnic group from Southern Mexico. The PCA comes from this DNA study. The Bolivians according to this paper has some European admixture while the Totonacs are 100%/close to 100% Amerindian. CHB/JPT are Han Chinese from Beijing, Japanese from Tokyo while CEU are Americans of European descent from Utah and YRI are Yorubas from West Africa. https://www.researchgate.net/publica..._the_New_World
Look at how far the Bolivians and Totonacs plot far away from the Chinese and Japanese samples towards the Whites of Utah. It is showing their ANE ancestry affect on them compared to 100% East Eurasians like Chinese and Japanese.
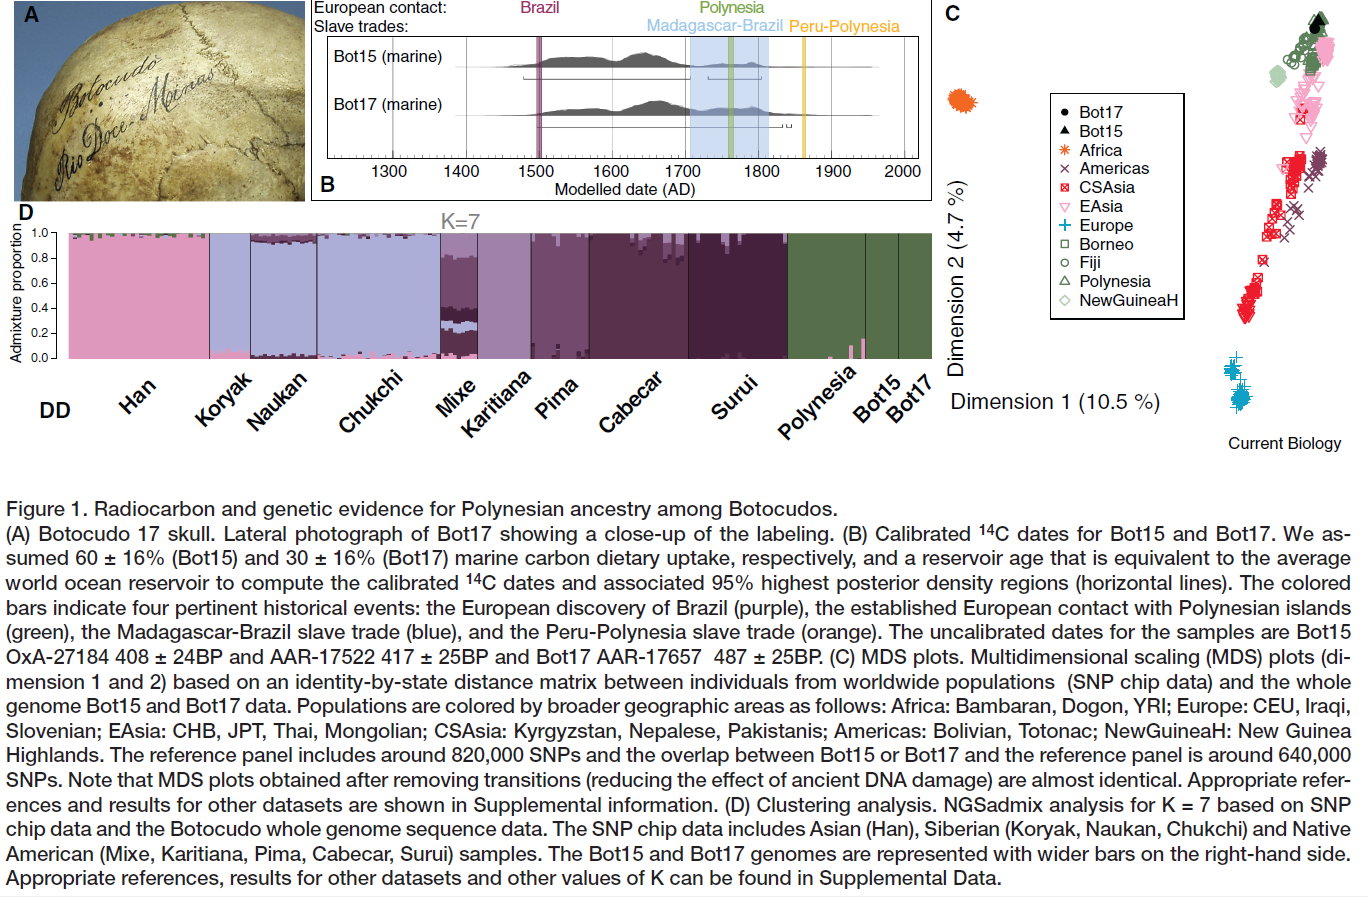
Also one more: This PCA from the Malaspinas DNA paper on Botocudo genomes: https://www.sciencedirect.com/scienc...60982214012743. Here it shows Amerindians plotting close to South-Central Asians from Kyrgyzstan and Nepal due to similar amounts of East and West Eurasian ancestry:


| Thumbs Up |
| Received: 4,863 Given: 2,946 |
I divided G25 modern averages in clusters:
Then I did a PCA of the clusters for Europeans, Central Asians, North Asians, East Asians, Southeast Asians, and Americans:Code:curl -Ls 'drive.google.com/uc?export=download&id=1wZr-UOve0KUKo_Qbgeo27m-CQncZWb8y'>modernave R -e 't=read.csv("modernave",header=T,row.names=1,check.names=F);k<-cutree(hclust(dist(t)),k=16);write.table(k,"clusters",sep=" ",quote=F,col.names=F)'
In my graph, the percentage shown next to PC1 is bigger than the percentage shown next to PC2 because there's so many European and East/Southeast Asian populations in the plot. The percentage becomes smaller if I include less European populations. One horizontal square still represents the same distance as one vertical square.
Nganasans look like they're on a cline that goes from Southeast Asians to Americans. The Uralic cline from Saami to Nganasans is closer to Americans than the Turkic cline from Tatars to Yakuts. Maybe it's because of higher ANE ancestry in Uralics.
However in G25, Surui are about as far from Nganasan as from Han or Mari:
Distance to: Surui
.019 Karitiana
.089 Mayan
.386 Eskimo
.401 Greenlander_East
.441 Greenlander_West
.451 Chukchi
.473 Tlingit
.543 Shor
.559 Selkup
.559 Kazakh
.562 Ket
.562 Khanty
.563 Buryat
.564 Nivkh
.565 Nenets
.566 Todzin
.568 Mansi
.601 Han_Shandong
.604 Onge
.606 Nganassan
.616 Saami
.616 Mari
Last edited by Komintasavalta; 03-05-2021 at 02:16 PM.


| Thumbs Up |
| Received: 1,078 Given: 911 |
It depends on individual.
| Thumbs Up |
| Received: 610 Given: 2,309 |
Interesting I would expected Native Americans to plot more closely with the Altaians, Khakass, Kyrgyz in that PCA due to their similar amounts of East and West Eurasian ancestries but it seems like there are probably genetic drifts and other factors that very likely cause Natives to plot really faraway from others.
Keep in mind though that American Indians are very genetically drifted so that's why the distance to other pops is very massive. If we can remove the genetic drift, maybe the distance will be much less. Probably the same case as Australoids like Papuans/Melanesians and Abos who are genetically very isolated from almost other groups as well and thus make them genetically very distant from everyone.


| Thumbs Up |
| Received: 2,760 Given: 5,256 |
Very strange.
Europeans in a cluster with MENAs and Iranians but Sardinians and Lapps are outside of this cluster by a big margin?
I might be slightly closer to Iranians than Sardinians but not by a huge margin.
But Southern and Western Europeans are definitely closer to Sardinians than Iranians.
| Thumbs Up |
| Received: 4,863 Given: 2,946 |
Yeah, I tried choosing different ethnic groups in place of Poles here to represent Europeans, but they always clustered with Sardinians. I tried the clustering methods "ward.D2", "complete", and "single".
Code:curl -Ls 'drive.google.com/uc?export=download&id=1wZr-UOve0KUKo_Qbgeo27m-CQncZWb8y'>modernave awk -F, 'NR==FNR{a[$0];next}$1 in a' <(printf %s\\n Saami Iranian_Fars Syrian Sardinian Moroccan Polish) modernave>/tmp/a R -e 'install.packages("ape",repos="https://cloud.r-project.org")' R -e 'library("ape");png("/tmp/a.png",w=300,h=300);t=read.csv("/tmp/a",header=F,row.names=1,check.names=F);plot(as.phylo(hclust(dist(t),method="ward.D2")),cex=1.3,font=1,underscore=T);dev.off()'
| Thumbs Up |
| Received: 4,863 Given: 2,946 |
Yeah, the distance between Australian and Han_Shanghai is .58 on G25, and the distance between Surui and Han_Shanghai is .61, even though Surui are the Americans who are the furthest from Mbuti.
Koinanbe (1.10) and Papuan (1.10) are even further from Mbuti than Australian (.99).
Here's a PCA of the populations closest to Koinanbe and the populations closest to Surui. Papuans (Koinanbe, Kosipe, Papuan) might be at the end of the Australo-Melanesian cline because they're more drifted than Australians.

Last edited by Komintasavalta; 03-05-2021 at 03:57 PM.
| Thumbs Up |
| Received: 1,628 Given: 1,115 |
I generated a PCA using Eurogenes K15 components.
As expected, modern European populations are not far from each other except some (Saami, Chuvash, Mari).
It's strange that Amerindians and Oceanians are so close here, but there were only 2 population samples of the Oceania. It's right that Oceanians are close to Southeast Asians.
There are too little variation between Sub-Saharan African populations (San, Pygmy, Bantu). I think that's because there were too less components for them.

Last edited by Sandis; 03-05-2021 at 07:06 PM.
| Thumbs Up |
| Received: 1,628 Given: 1,115 |
2D PCA model for 244 populations needs higher resolution.
I later found that someone made 3D PCA from this data:
I added component labels approximately in my 2D model for better understanding:

There are currently 1 users browsing this thread. (0 members and 1 guests)
 Posting Permissions


 Reply With Quote


Bookmarks