


 Latin America
 Brazil
4


| Thumbs Up |
| Received: 2,495 Given: 884 |
Sendo na ordem Brancos, Pardos e Negros.
1. São Paulo (SP) --- 17.879.997 --- 65,5% --- 27,0% --- 4,9%
2. Rio de Janeiro (RJ) --- 10.996.308 --- 53,1% --- 35,2% --- 10,5%
3. Belo Horizonte (MG) --- 4.358.171 --- 47,4% --- 42,9% --- 8,5%
4. Porto Alegre (RS) --- 3.798.197 --- 85,8% --- 6,5% --- 6,8%
5. Recife (PE) --- 3.464.982 --- 41,4% --- 52,1% --- 5,2%
6. Salvador (BA) --- 3.225.448 --- 21,1% --- 57,0% --- 20,0%
7. Fortaleza (CE) --- 3.056.769 --- 39,1% --- 56,9% --- 3,1%
8. Brasília (DF-GO-MG) --- 2.962.976 --- 46,1% --- 47,4% --- 5,1%
9. Curitiba (PR) --- 2.768.418 --- 81,4% --- 14,4% --- 2,6%
10. Campinas (SP) --- 2.352.036 --- 74,7% --- 19,2% --- 4,4%
11. Belém (PA) --- 1.922.226 --- 30,2% --- 63,7% --- 4,8%
12. Goiânia (GO) --- 1.743.431 --- 53,8% --- 40,6% --- 4,3%
13. Santos-Guarujá (SP) --- 1.476.820 --- 63,9% --- 30,2% --- 4,5%
14. Manaus (AM) --- 1.472.987 --- 31,3% --- 64,4% --- 2,5%
15. Vitória (ES) --- 1.438.596 --- 44,8% --- 47,3% --- 6,7%
16. São José dos Campos-Taubaté (SP) --- 1.237.042 --- 78,5% --- 16,3% --- 3,5%
17. Natal (RN) --- 1.116.543 --- 43,7% --- 51,0% --- 4,4%
18. São Luís (MA) --- 1.091.979 --- 30,8% --- 58,2% --- 9,8%
19. Maceió (AL) --- 1.029.734 --- 38,9% --- 55,0% --- 4,8%
20. João Pessoa (PB) --- 955.886 --- 42,9% --- 51,5% --- 4,1%
21. Teresina (PI-MA) --- 929.521 --- 26,0% --- 65,7% --- 7,1%
22. Aracaju (SE) --- 750.833 --- 32,0% --- 58,9% --- 7,5%
23. Ribeirão Preto (SP) --- 744.457 --- 73,8% --- 19,2% --- 5,5%
24. Florianópolis (SC) --- 732.906 --- 89,4% --- 5,7% --- 4,0%
25. Cuiabá (MT) --- 726.220 --- 39,9% --- 51,1% --- 7,2%
26. Sorocaba (SP) --- 708.955 --- 80,9% --- 14,4% --- 2,9%
27. Londrina (PR) --- 678.032 --- 73,5% --- 19,5% --- 3,5%
28. Campo Grande (MS) --- 675.283 --- 57,6% --- 36,7% --- 3,3%
29. Feira de Santana (BA) --- 587.312 --- 21,3% --- 60,7% --- 16,9%
30. Jundiaí (SP) --- 580.131 --- 77,3% --- 17,9% --- 3,5%
31. Limeira-Rio Claro-Araras (SP) --- 578.646 --- 81,7% --- 13,2% --- 4,1%
32. Campina Grande (PB) --- 533.232 --- 45,9% --- 50,0% --- 3,0%
33. Maringá (PR) --- 521.795 --- 73,2% --- 20,9% --- 3,1%
34. Joinville (SC) --- 511.812 --- 90,8% --- 5,8% --- 2,3%
35. Uberlândia (MG) --- 501.214 --- 64,9% --- 27,6% --- 6,4%
36. São José do Rio Preto (SP) --- 497.702 --- 83,1% --- 12,2% --- 3,1%
37. Juiz de Fora (MG) --- 477.997 --- 64,3% --- 22,5% --- 12,2%
38. Caxias do Sul (RS) --- 462.879 --- 89,5% --- 7,4% --- 2,4%
39. Volta Redonda-Barra Mansa (RJ) --- 455.122 --- 58,2% --- 29,0% --- 11,8%
40. Blumenau (SC) --- 435.225 --- 95,1% --- 3,1% --- 1,0%
41. Juazeiro do Norte-Crato (CE) --- 422.129 --- 35,0% --- 59,3% --- 4,7%
42. Caruaru (PE) --- 417.848 --- 56,9% --- 38,6% --- 3,4%
43. Ipatinga (MG) --- 414.111 --- 44,9% --- 47,3% --- 7,1%
44. Campos dos Goytacazes (RJ) --- 407.168 --- 56,8% --- 30,5% --- 11,8%
45. Itajaí-Balneário Camboriú (SC) --- 404.854 --- 89,2% --- 6,4% --- 2,7%
46. Piracicaba (SP) --- 401.268 --- 79,7% --- 14,1% --- 5,3%
47. Petrolina-Juazeiro (PE-BA) --- 393.105 --- 32,5% --- 59,6% --- 6,6%
48. Macapá (AP) --- 375.733 --- 28,0% --- 65,4% --- 5,1%
49. Bauru (SP) --- 359.132 --- 75,1% --- 18,0% --- 4,8%
50. Arapiraca (AL) --- 357.203 --- 37,2% --- 57,6% --- 4,2%
51. Porto Velho (RO) --- 347.768 --- 33,2% --- 60,7% --- 4,1%
52. Pelotas (RS) --- 346.876 --- 83,3% --- 6,2% --- 9,6%
53. Cabo Frio-Araruama (RJ) --- 330.028 --- 56,5% --- 31,6% --- 10,7%
54. Franca (SP-MG) --- 324.947 --- 74,8% --- 19,8% --- 4,7%
55. Criciúma (SC) --- 316.684 --- 91,9% --- 3,3% --- 4,2%
56. Imperatriz (MA-TO) --- 312.546 --- 30,0% --- 64,0% --- 5,4%
57. Montes Claros (MG) --- 306.947 --- 42,8% --- 50,9% --- 5,4%
58. Presidente Prudente (SP) --- 296.300 --- 70,5% --- 21,9% --- 3,9%
59. Ponta Grossa (PR) --- 288.476 --- 84,7% --- 12,1% --- 2,5%
60. Anápolis (GO) --- 288.085 --- 55,1% --- 40,6% --- 3,4%
61. Petrópolis (RJ) --- 286.537 --- 70,2% --- 19,8% --- 8,7%
62. Rio Branco (AC) --- 278.646 --- 30,3% --- 65,0% --- 3,7%
63. Mogi Guaçu-Mogi Mirim (SP) --- 277.928 --- 84,4% --- 11,6% --- 3,3%
64. Foz do Iguaçu (PR) --- 276.911 --- 73,9% --- 21,6% --- 2,9%
65. Araçatuba-Birigüi (SP) --- 272.399 --- 71,9% --- 22,1% --- 3,4%
66. Cascavel (PR) --- 271.926 --- 78,7% --- 18,1% --- 2,1%
67. Santarém (PA) --- 262.548 --- 26,1% --- 69,1% --- 3,5%
68. Vitória da Conquista (BA) --- 262.494 --- 36,1% --- 56,1% --- 6,5%
69. Itabuna (BA) --- 261.545 --- 23,6% --- 63,3% --- 11,0%
70. Guaratinguetá-Lorena (SP) --- 258.109 --- 72,5% --- 22,2% --- 4,5%
71. Uberaba (MG) --- 257.430 --- 69,4% --- 21,4% --- 8,2%
72. Governador Valadares (MG) --- 254.097 --- 42,6% --- 49,9% --- 6,5%
73. Santa Maria (RS) --- 250.760 --- 86,2% --- 8,0% --- 5,0%
74. Apucarana-Arapongas (PR) --- 235.128 --- 75,8% --- 19,0% --- 3,2%
75. Araraquara (SP) --- 228.941 --- 77,7% --- 16,4% --- 4,8%
76. Itu-Salto (SP) --- 228.525 --- 74,9% --- 20,1% --- 3,8%
77. Ilhéus (BA) --- 222.127 --- 18,4% --- 67,0% --- 12,9%
78. São Carlos (SP) --- 219.460 --- 77,5% --- 17,1% --- 4,0%
79. Marília (SP) --- 214.311 --- 69,6% --- 23,1% --- 4,2%
80. Mossoró (RN) --- 213.841 --- 44,3% --- 51,2% --- 4,0%
81. Divinópolis (MG) --- 213.744 --- 70,2% --- 22,9% --- 5,8%
82. Rio Grande (RS) --- 210.340 --- 82,6% --- 8,0% --- 8,6%
83. Sobral (CE) --- 202.338 --- 32,8% --- 61,0% --- 5,1%
84. Boa Vista (RR) --- 200.568 --- 27,7% --- 65,0% --- 3,7%

| Thumbs Up |
| Received: 26,236 Given: 43,780 |
Rio de Janeiro sendo maioria branca e uma piada.
| Thumbs Up |
| Received: 2,495 Given: 884 |
Toda pesquisa no Brasil é por auto-afirmação. Sendo assim, isso mostra como a população de certo local se imagina.Originally Posted by Tooting Carmen


| Thumbs Up |
| Received: 2,819 Given: 5,369 |
It would be cool If you or someone create or post a useful study about the rest of the country specially the center regions and northern Brazilian regions, I know the South and South east Is the most "populated "
But still over represented those regions...


| Thumbs Up |
| Received: 2,779 Given: 208 |
| Thumbs Up |
| Received: 2,495 Given: 884 |
Well, those are Pardo regions by essence.
| Thumbs Up |
| Received: 2,779 Given: 208 |
South 75-80% White (30 millions)
Southeast 50-60% White (110 millions)
Northeast 30-35% White (50 millions)
North and Midwest 30-35% White (22 millions)


| Thumbs Up |
| Received: 92 Given: 35 |
maybe in the interior, in the big cities is less,
| Thumbs Up |
| Received: 92 Given: 35 |
less too
| Thumbs Up |
| Received: 2,779 Given: 208 |
The percentages I put are from the census. Curitiba has 75% of self-declared whites
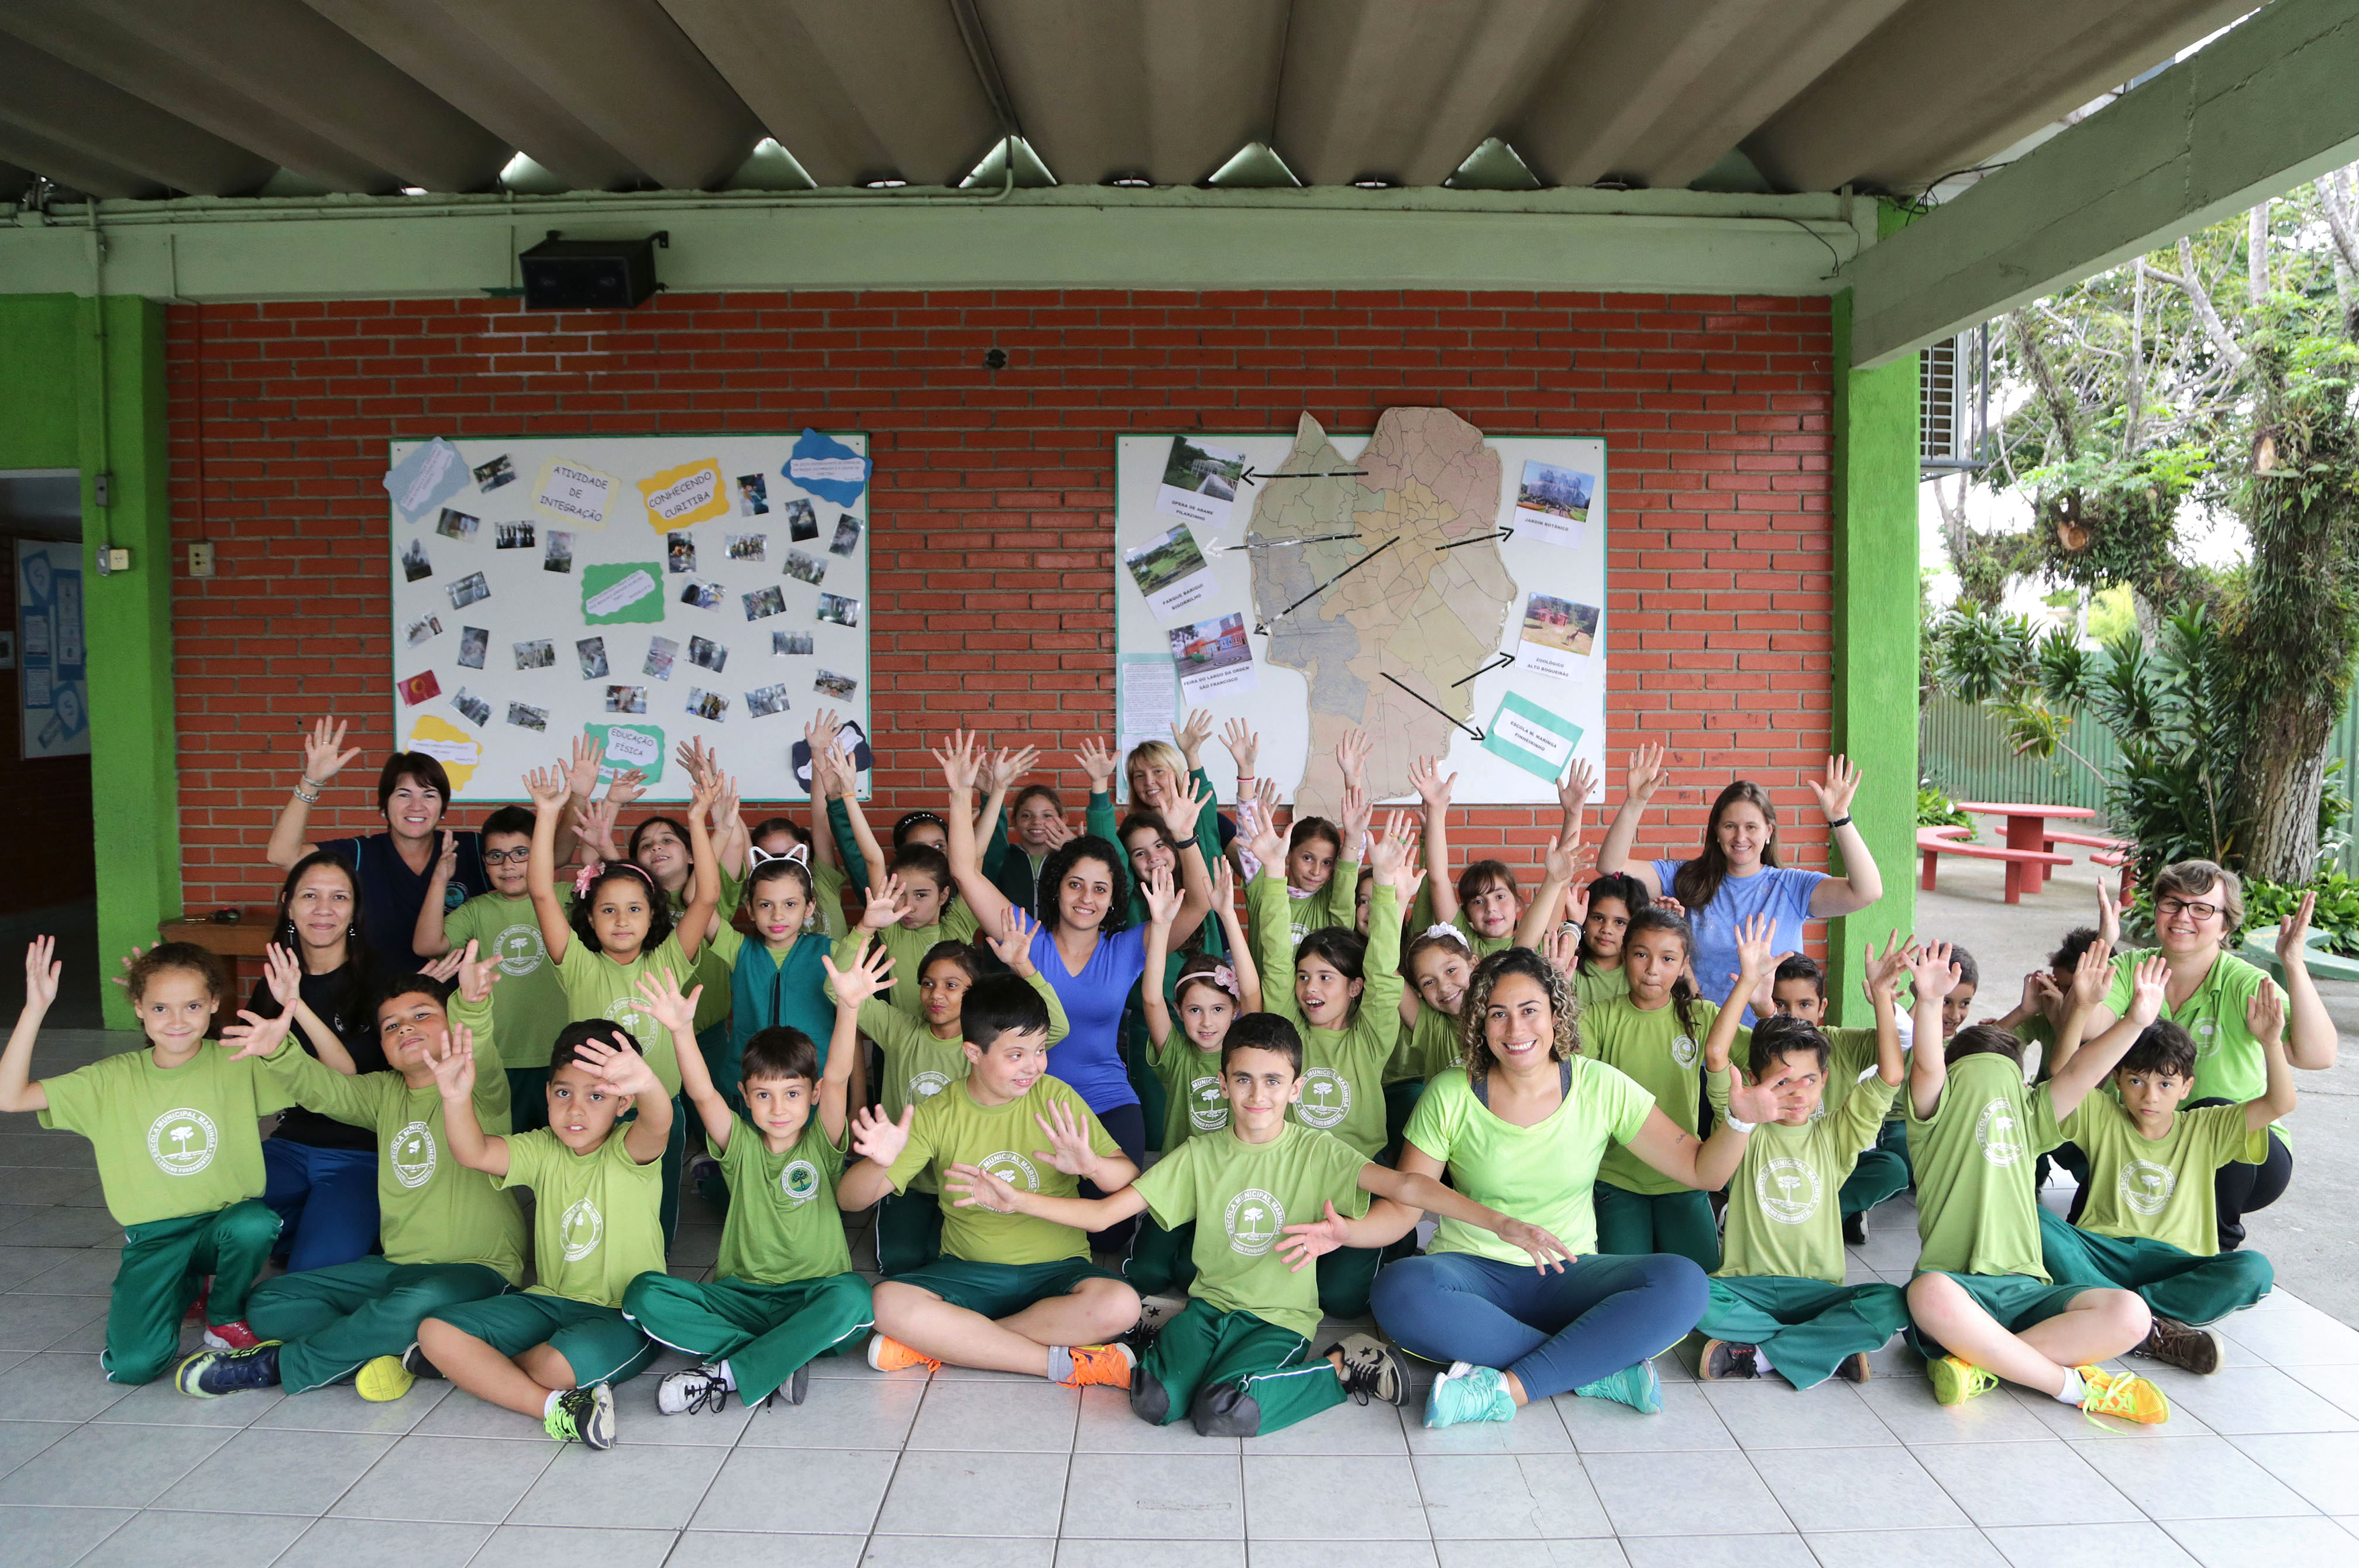
public school:
It depends a lot on the place. Browns are generally poorer in some places they can be up to 50% of the people you see.
There are currently 1 users browsing this thread. (0 members and 1 guests)
 България
 Posting Permissions

 Reply With Quote

Bookmarks