


 France
7


| Thumbs Up |
| Received: 1,196 Given: 677 |
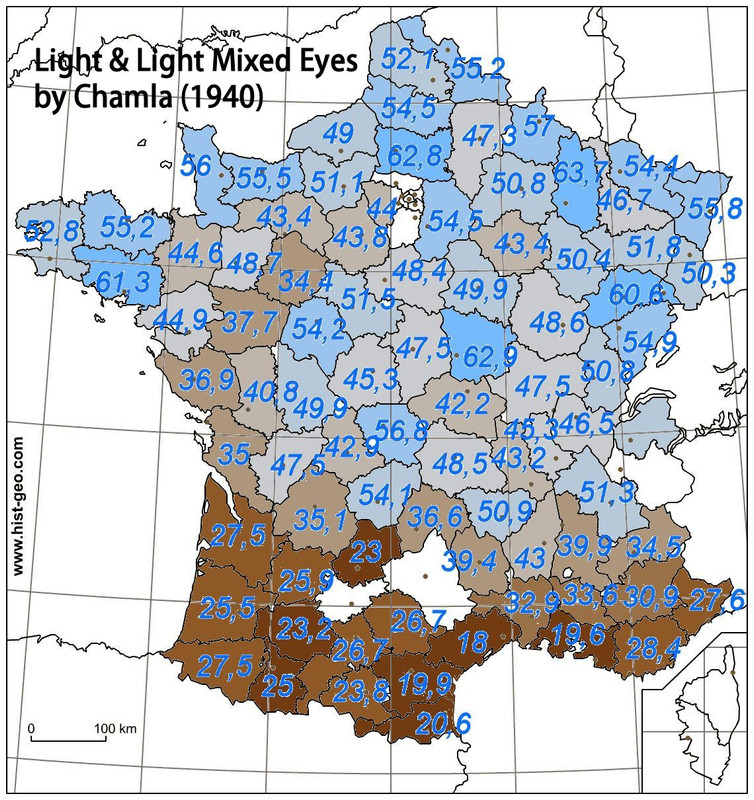
Here is the map of light eyes I made from the numbers by Chamla (1940) who studied 10.500 people - around 100 people from every department in France.
The spectrum is categorized into:
1.Blue & Blue-Gray
2.Intermediate Light
3.Intermediate Dark
4.Dark
The numbers in the map are for the first two categories combined.
It likely includes gray and light green but excludes dark green and hazel.
The percentages in various departments range from 18% - 63,7%
Overall number of light eyes for entire France is 45%
Another study done on 11.000 people in 1880 gave light eyes at very similar number - 47%
A more specific map with numbers for each department:
(few departments I was unable to find - likely because they have changed since 1940)
and post please how it looks now")

| Thumbs Up |
| Received: 2,473 Given: 10,006 |
Peaks in Brittany. British-Celtic influence?


| Thumbs Up |
| Received: 5,396 Given: 6,059 |
French are probably slightly more light-eyed than Croats but comparable. Slovenes are somewhere close also, but I would say bit more light eyed than both.
| Thumbs Up |
| Received: 1,196 Given: 677 |
If someone tried that he would get arrested LOLOriginally Posted by Meredydd

| Thumbs Up |
| Received: 1,196 Given: 677 |
Croatia 36-40% based on my estimate from scientific and personal studies. North Croatia could be comparable to France as a whole. Slovenia 52% for men and 57% for women (ethnic Slovenes)
The low numbers for French Mediterranean coast surprised me thought. Must be Barbary influence.


| Thumbs Up |
| Received: 799 Given: 291 |
Yes but if it was included, many southern regions like Béarn would be way highter. I would say, if we include greenish eyes, 50% of béarneses are light eyed.
| Thumbs Up |
| Received: 5,396 Given: 6,059 |
I doubt Croats are less than 40% light eyed, in deep south only. Where I live half of people have light eyes. I saw 43% figure for Croats somewhere and it looks decent.
Did you see this study about Slovenes ?
https://www.ncbi.nlm.nih.gov/pmc/articles/PMC3760663/
Blue eye color was observed in 44.7%, brown in 29.6%, and intermediate in 25.7% participants.
Sample is rather small, (105 people) though.
| Thumbs Up |
| Received: 1,196 Given: 677 |
Agreed. I chose an arbitrary breaking point which was of my personal interest. I don't feel like counting again, but you can do it yourself if you have the time, I can provide you with the source.
| Thumbs Up |
| Received: 1,196 Given: 677 |
Yes, I'm aware of that study. I have three more studies of Slovenians with larger sample sizes. Regarding Croatia...coastal regions drag down the average.In Dalmatia light eyes aren't very common. Maybe because it was settled by Morlachs. There are only two studies for that country and both are very old.
There are currently 1 users browsing this thread. (0 members and 1 guests)
 Posting Permissions


 Reply With Quote
Bookmarks