


 Hrvatska
8


| Thumbs Up |
| Received: 1,195 Given: 677 |
First of all let me say that if thee kind of topics don't sit well with you, let me remind you that you clicked on the thread yourself. If you are triggered by this, the "back" button on your browser is functioning properly so take a hike. For the rest who are interested in the results continue reading.
These are the final results of my several weeks long study into blond hair in Croatia's town and cities on matura.hr, just as I did with eye color previously here:
https://www.theapricity.com/forum/sh...map-of-Croatia
I counted only males because females very often dye their hair. The study was done on high school graduates so mostly around 18 years old with some exceptions of course. My description of hair color I counted under blond would be "dark blond", however others may simply see it as "bond" on one hand or merely "light brown" hair on the other. The point is not to argue how this hair color should be labelled, but to have consistent standards of hair color so one can compare the differences for various Croatian regions.
It should be noted the number also includes pure red hair, however I did not distinguish it from blond as it was very rare so it did not effect the overall figures in any significant way. Example of red hair I counted under blond: https://i.postimg.cc/rFPZ78T0/maturant-3.jpg
Example of my standards for Blond:
NOT yet blond:
https://i.postimg.cc/QthX2gDM/NOOT.jpg
https://i.postimg.cc/MHX8wdFz/Se-vedno-ne.jpg
Already blond:
https://i.postimg.cc/DZRK2qks/Ze-taprav.jpg
https://i.postimg.cc/hGwYxcyR/ZE-555.jpg
The website unfortunately has a decent share of photographs taken in very poor lighting , so I compensated this by having a slightly wider criteria for those photographs which were taken under these conditions. However I still think this bad lighting had the effect of reducing the actual share of blonds because I still noticed classes that were taken in poor lighting had significantly less blonds than others despite my compensation. Overall I think the final number of the share of blonds for the whole country should be taken with a grain of salt, but I still think the study is valuable to compare different Croatian regions (which was the purpose of my study), because poor lit photos appeared to be roughly equally distributed across regions.
Example of a well lit group photo (ideally all of them should be lit like this)
http://www.matura.hr/maturanti/2013_...edekovcina/3B/
Example of a poorly lit group photo from the same town
http://www.matura.hr/maturanti/2004_...edekovcina/3a/
As you can see there appears to be much less light haired individuals.
Other photos (a very small number) were taken in poor lighting but were artificially "lightened" in photoshop. Here I used the opposite tactic and counted only those that look very light blond.
Example:
https://i.postimg.cc/KvYqQhxR/maturant-15.jpg
Of course with so many sample I encountered a few gypsies and non White individuals which I excluded from the study.
Example of a gypsy:
https://i.postimg.cc/7Lxt4ZBq/Cigo1.jpg
Example of a non White:
https://i.postimg.cc/nhscknKc/nonwhite.jpg
Obviously I also did not include bald people or those that wore hats making their hair color not visible.
This time I also distinguished ethnic Serbs from ethnic Croats in the city of Vukovar because the city has ethnically segregated classes. You can see the results for Vukovar below. It is also important to remember that ethnic Serbs don't just live in Vukovar, but in many other Croatian regions, however other cities don't have segregated classes so I didn't distinguish them from Croats. Official census from 2012 put ethnic Serbs in Croatia at around 4,5% but it's possible that real numbers are higher. Other minorities were virtually insignificant, I did count a few Italian schools in Istria, but most pupils had Croat names. I also did not encounter any significant numbers Czech or Hungarian names.
While I very rarely saw hair that appeared dyed with males (which i did not count under blond), there was sometimes the opposite problem. Many males with short hair used gels to make short hair stick up (especially here when they know they will get their school photo taken) and this like any moisture makes the hair appear darker. So it's possible the numbers could be slightly higher without this effect. Example of hair that could be blond without the gel that I didn't count as blond:
https://i.postimg.cc/rsGJ68D0/maturant-20-php.jpg
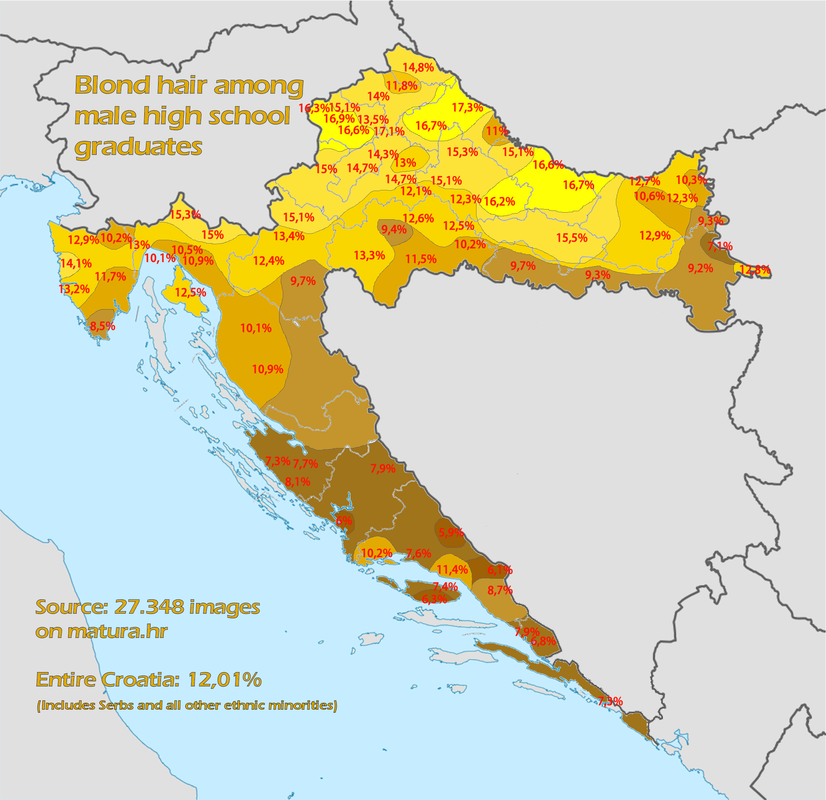
Results: Overall not too surprising as numbers don't par too much from other amateur studies (Xenophobic Prussian, ToeKneeHwin, TheBlade). What immediately jumps out is the low numbers from Zagorje which I expected to be the blondest region like it is the case with eye color. Varaždin in particular was unexpectedly low blond for some reason (only 11,8%). Perhaps lighting played tricks on me in that city or perhaps it's really that dark haired. The surrounding town of Ivanec is lighter so it may be like in Istria where smaller towns are blonder than large cities.
Like in eye color, Central Slavonia was lighter that I would have first thought before doing any studies. But this time after I did eye color, I wasn't surprised.
A bit surprised by the high share of blonds in North Adriatic in smaller towns but much lower numbers in large cities (Pula and Rijeka). In South Adriatic there wasn'tsuch disparity between towns and cities. The results fit reasonably well with what Weisbach found more than 130 years ago on the Adriatic coast. He found Istria and Kvarner around 14 percent in smaller towns (there was no large cities back then) and around 6-8 percent for Dalmatia. Interesting also, not a single town scored as low in blondism as Serbs from Vukovar, which I also did not expect.
The highest share of blondism in a town with large sample size was in Koprivnica at 17%, the lowest in Šibenik at 6%.
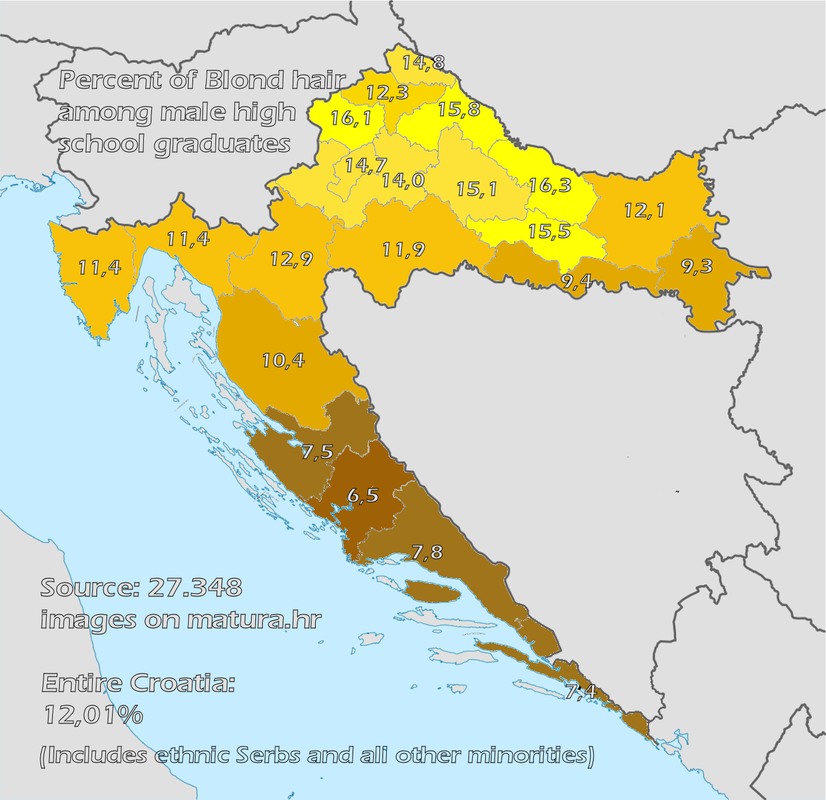
Major regions:
Zagorje 14,7%
Central Croatia 13,8%
Slavonia 11,9%
N. Adriatic 11,3%
Dalmatia 7,5%
Major cities:
Zagreb 14,7%
Split 7,6%
Rijeka 10,1%
Osijek 12,3%
Zadar 7,3%
Velika Gorica 14,7%
Slavonski Brod 9,3%
Pula 8,5%
Karlovac 15,1%
Sisak 12,6%
Varaždin 11,8%
Šibenik 6,0%
Dubrovnik 7,3%
Bjelovar 15,3%
Samobor 15,0%
Vinkovci 9,2%
Koprivnica 17,3%
Đakovo 12,9%
Vukovar 7,1%
-Croats 10,2%
-Serbs 4,4%
-Undetermined 5,1%
Čakovec 14,8%
Požega 15,5%
Sinj 5,9%
Petrinja 9,4%
Pannonian Part: 13,4%
Adriatic Part: 9,3%
Total towns/cities counted: 78
Total sample size: 27.348
Average sample size per city/town was 337
TOTAL Croatia 12,01%
Map by county:
Detail by city/town:

| Thumbs Up |
| Received: 3,471 Given: 1,541 |
great work.Originally Posted by Supercomputer

i think Feiichy said Dalmatians are the blondest Croats, lol.
| Thumbs Up |
| Received: 1,195 Given: 677 |
Yeah sometimes she doesn't make any sense, but you know....women. Is she back here tough?

| Thumbs Up |
| Received: 10,852 Given: 26,176 |
How much to buy this map?
| Thumbs Up |
| Received: 3,471 Given: 1,541 |
no, still banned.. it's boring without her
| Thumbs Up |
| Received: 1,195 Given: 677 |
200 bucks if you want to take credit for making it. Otherwise it's free.


| Thumbs Up |
| Received: 545 Given: 24 |
Feiichy is that one chick who believes Slovenians are blonder than Hungarians? she must be insane but still WB
| Thumbs Up |
| Received: 1,195 Given: 677 |
I thought that too after seeing some old studies....but things can change over such period of time. Plus it's difficult to synchronize the studies. Now I don't know to be honest.
| Thumbs Up |
| Received: 3,471 Given: 1,541 |
why not? they have around the same North European influence genetically. they could be at least on par by blondness.


| Thumbs Up |
| Received: 25,690 Given: 23,946 |
Slovenians are blonder than Hungarians.
There are currently 1 users browsing this thread. (0 members and 1 guests)
 Posting Permissions

 Reply With Quote
Bookmarks