


1


| Thumbs Up |
| Received: 26,234 Given: 43,774 |
https://www.bbc.co.uk/news/uk-51768274
Coronavirus UK map: How many confirmed cases are there in your area?
There have been more than 313,000 confirmed cases of coronavirus in the UK and almost 44,000 people have died, government figures show.
These numbers only include people who have been tested, and the total number of deaths relating to coronavirus is likely to be higher.
New cases decline - but concern over hotspots
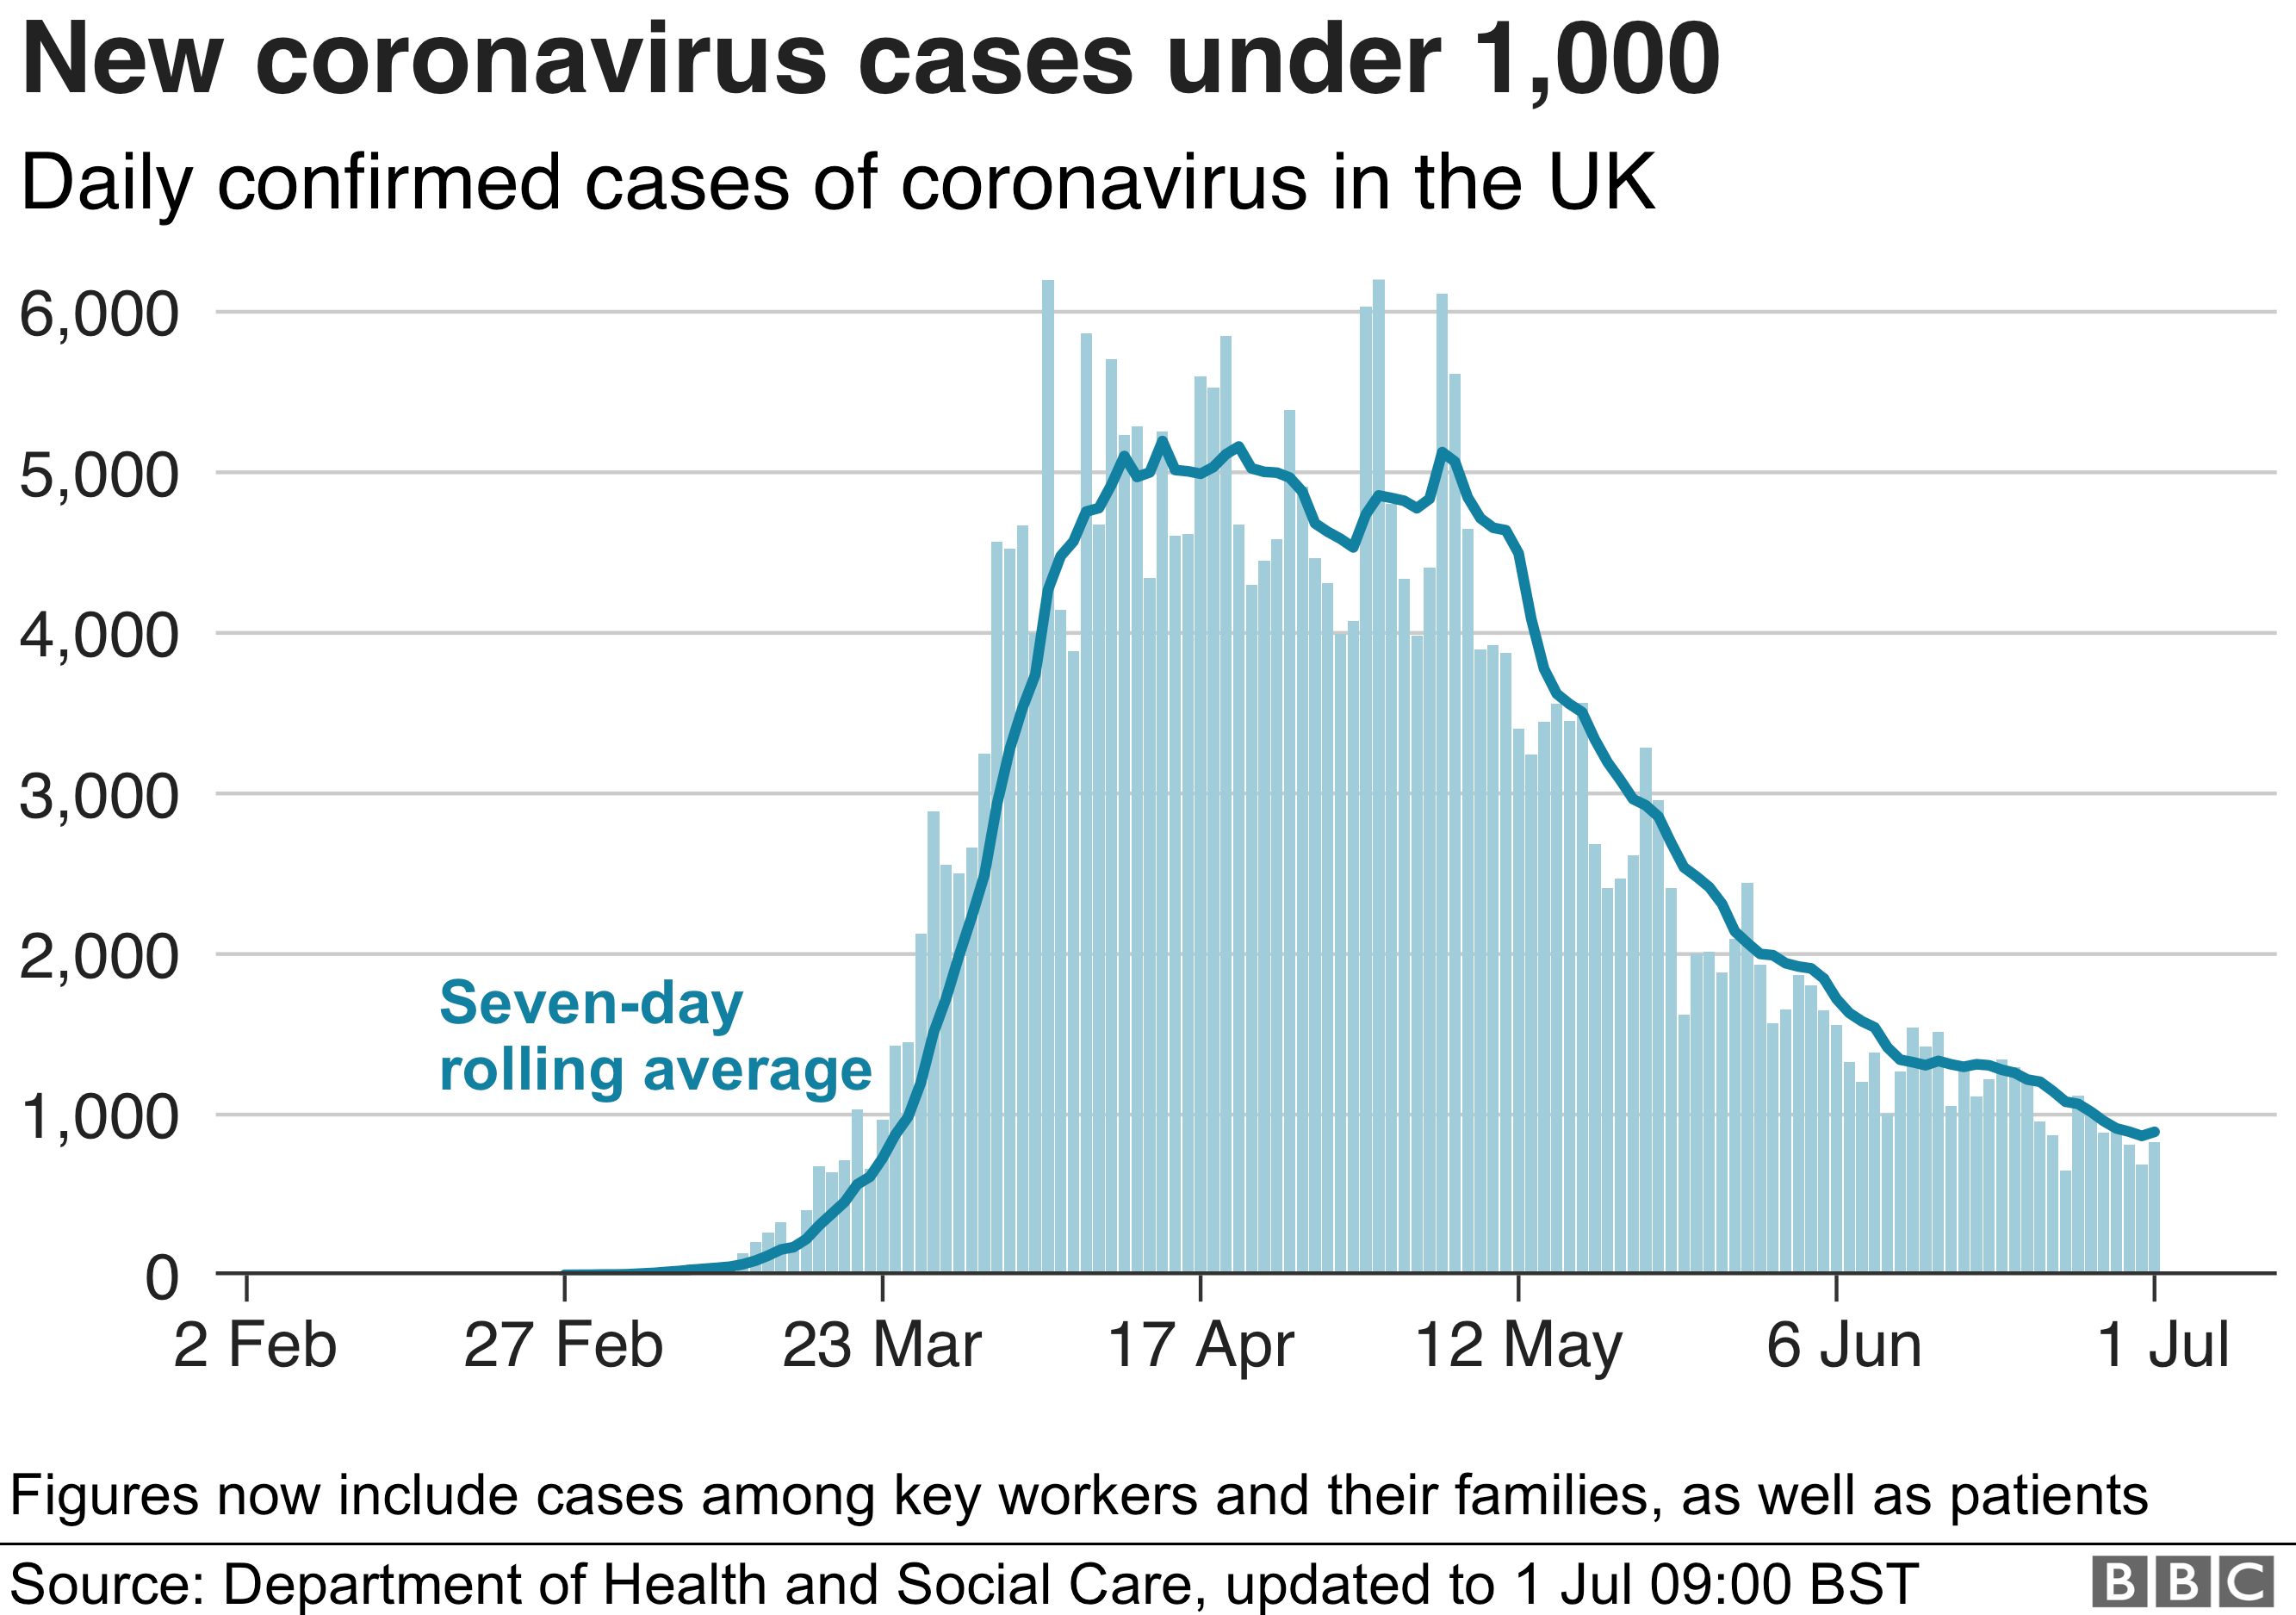
Across the country, the number of newly confirmed cases each day has been falling since a peak in April.
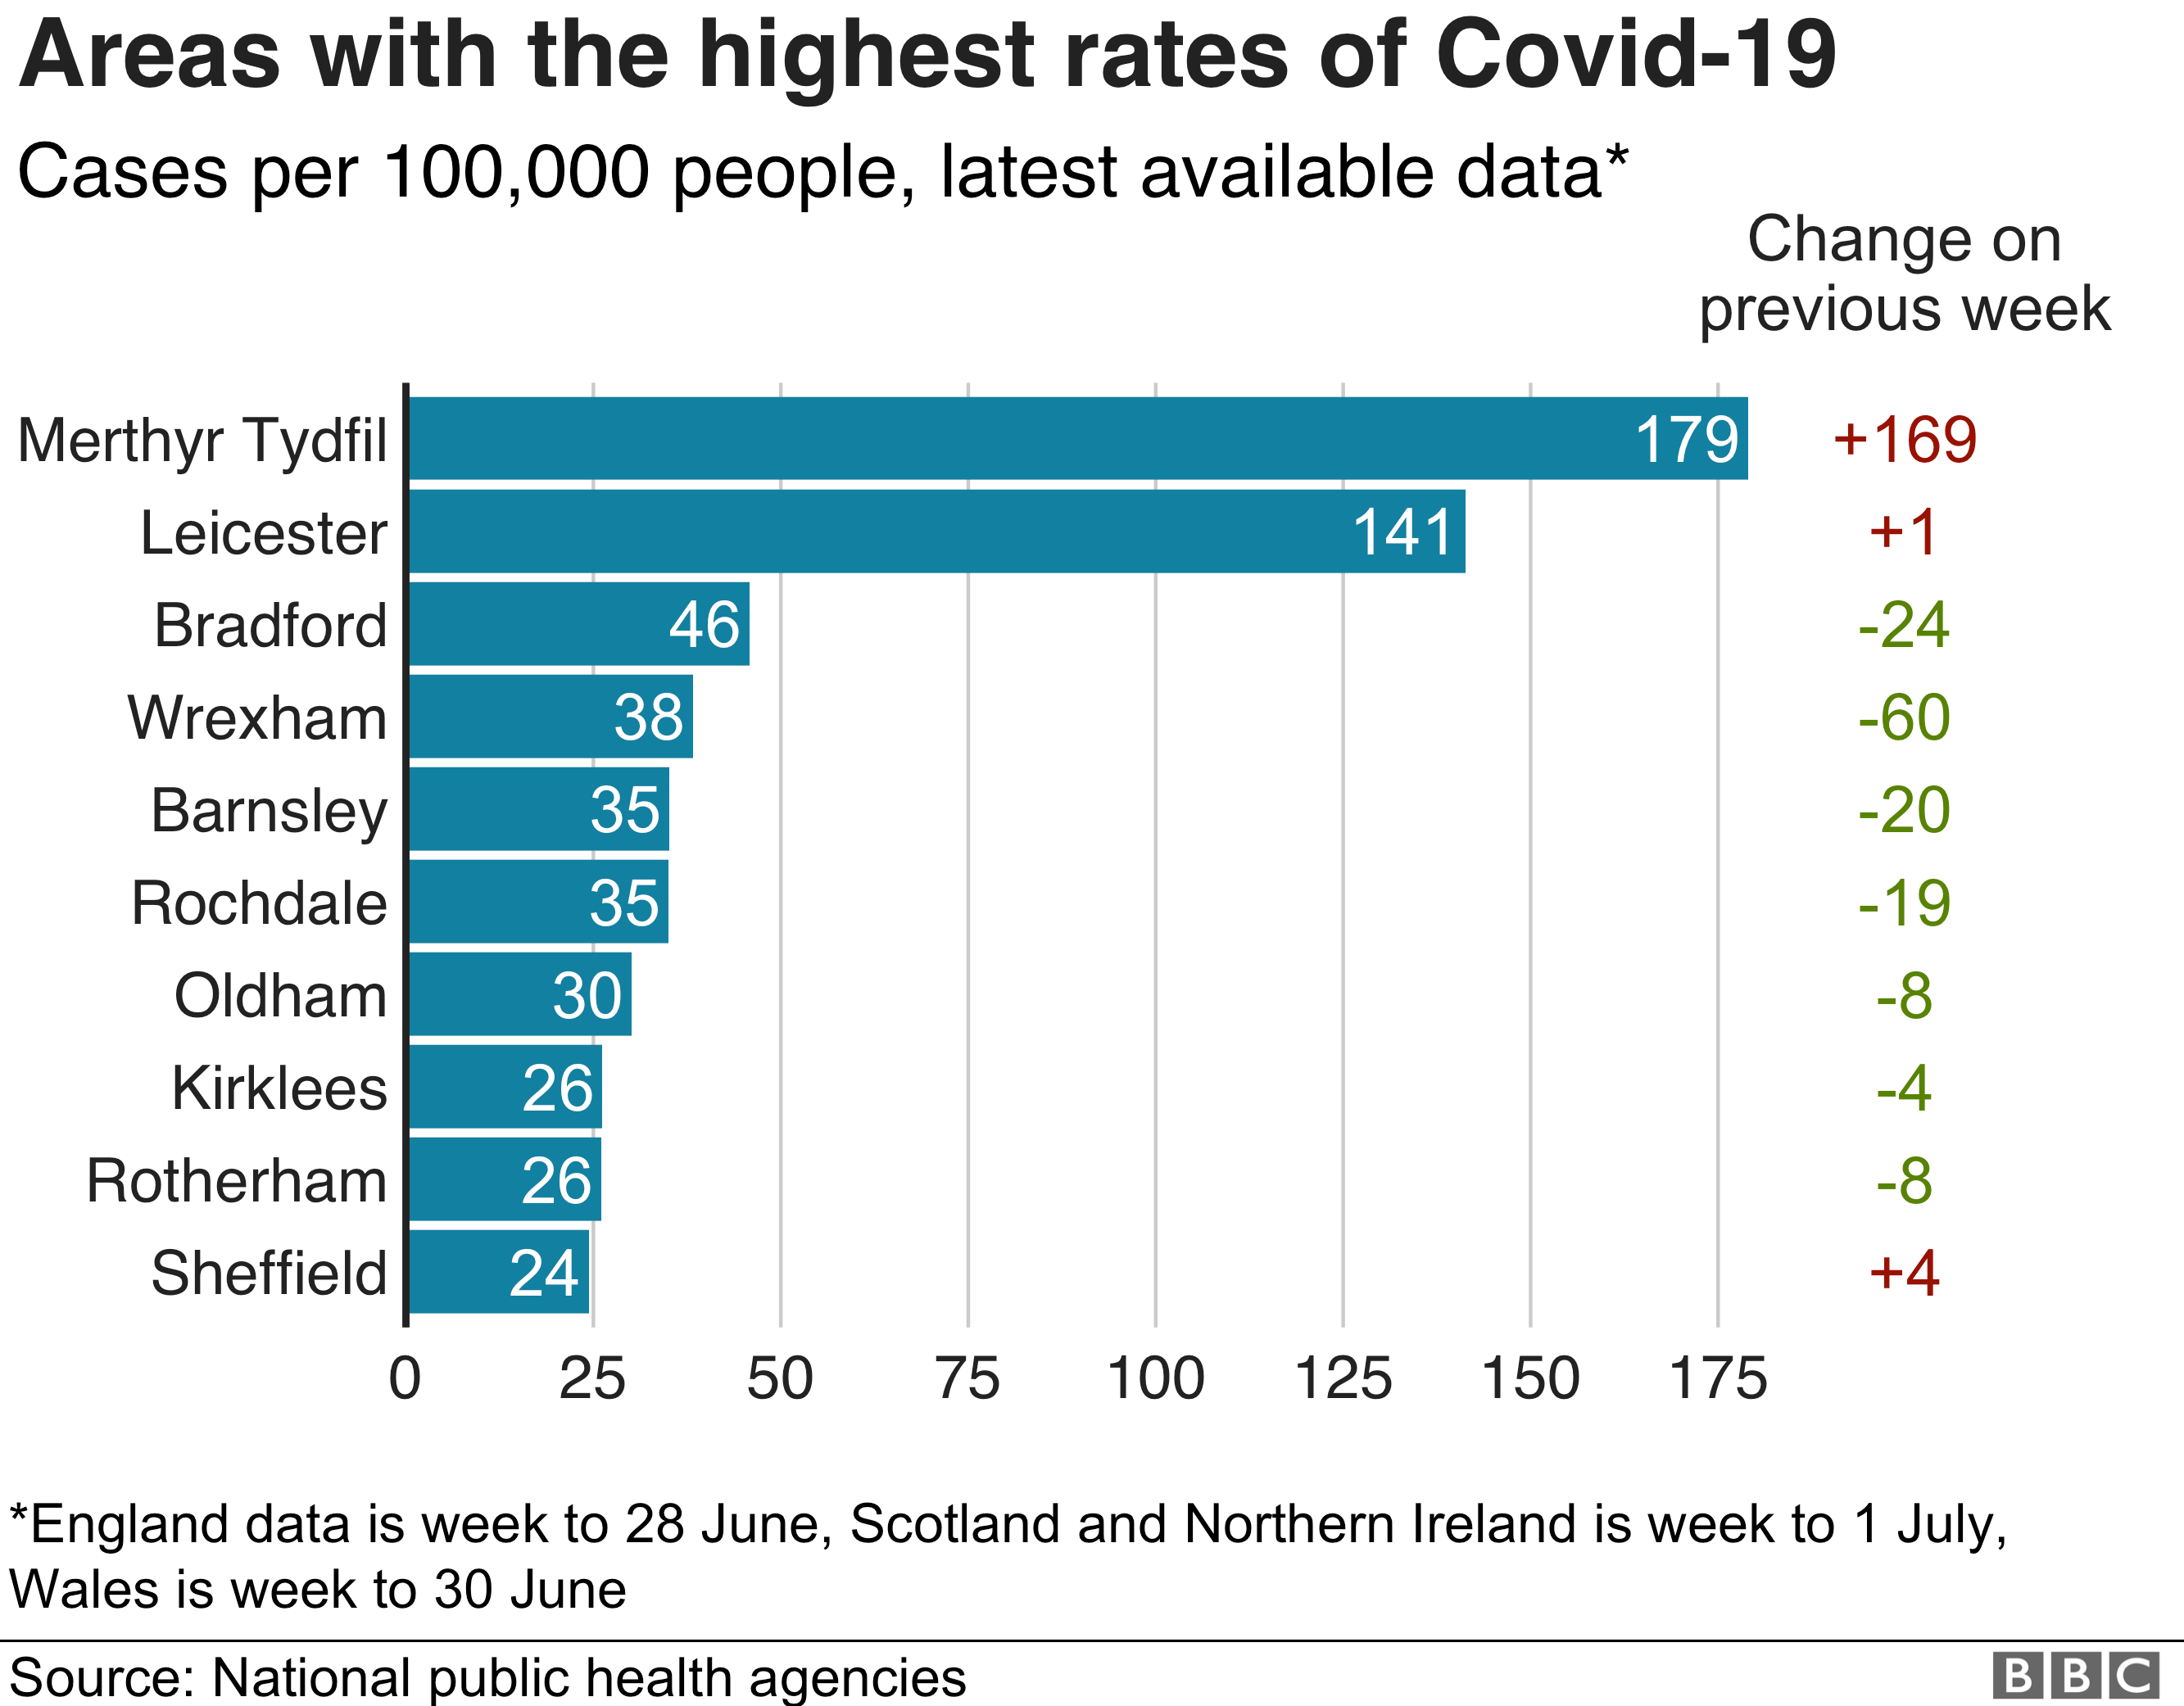
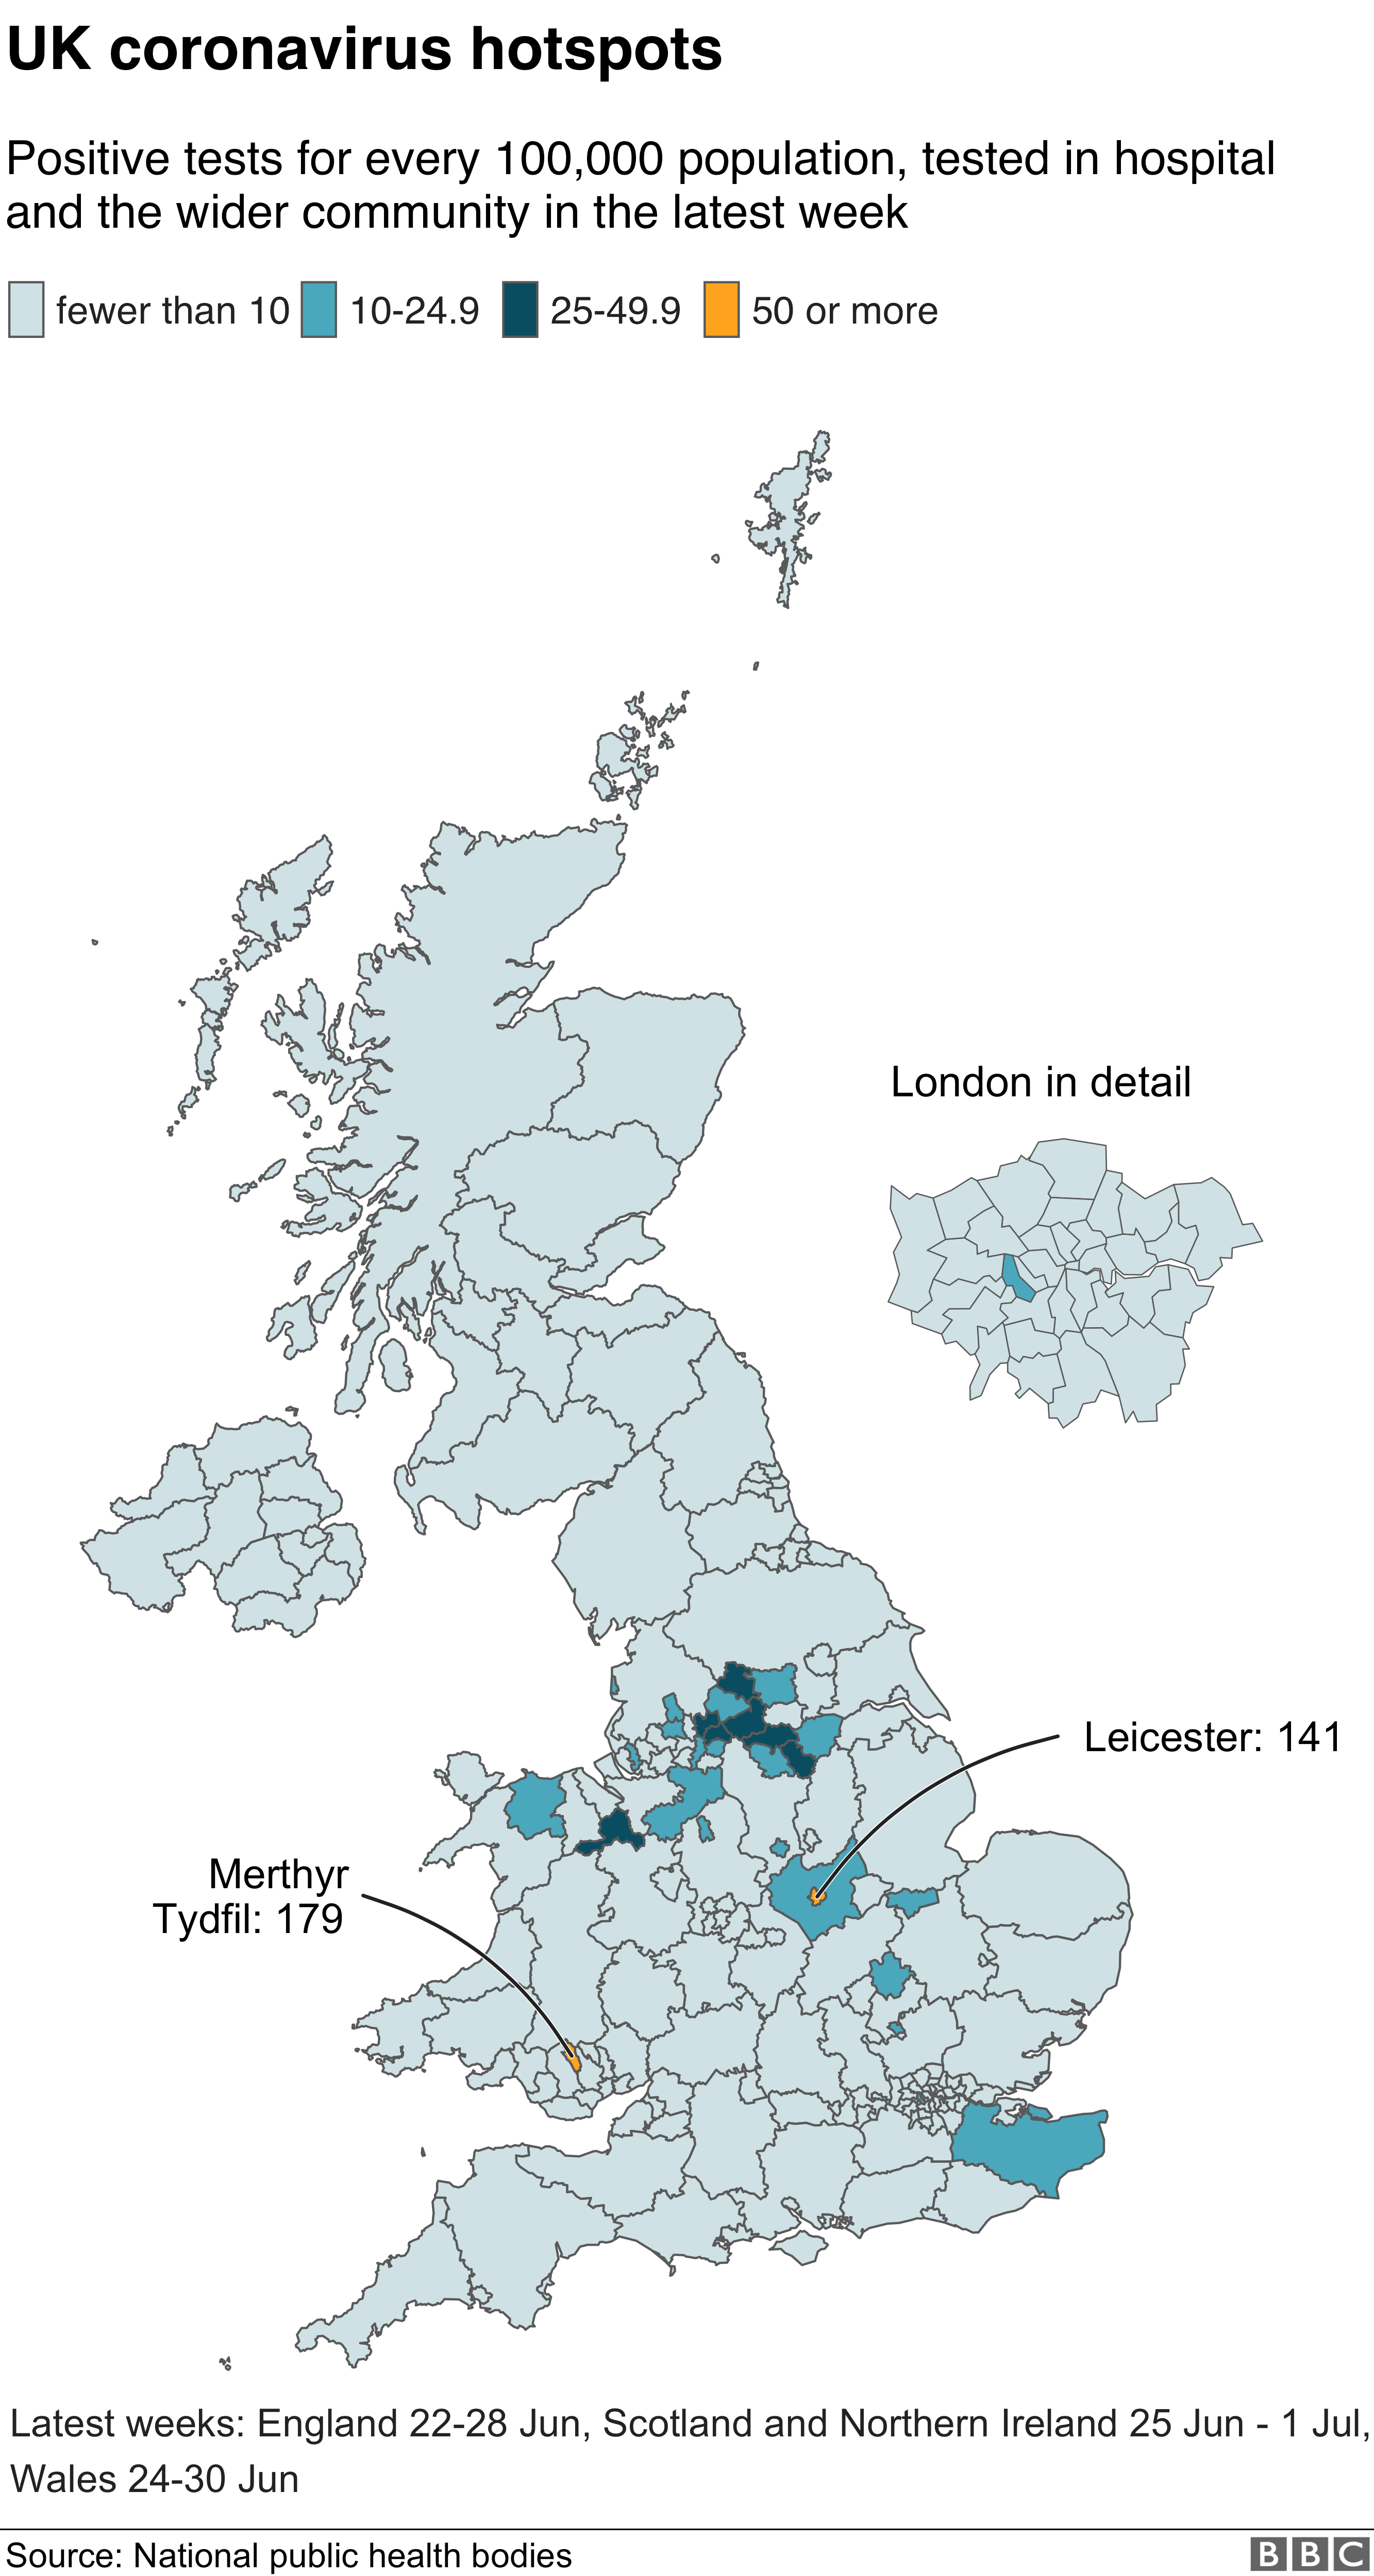
But the virus is spreading more quickly in some areas than others, causing localised hotspots.
Merthyr Tydfil saw the highest rate in the UK, with 177 out of every 100,000 people testing positive in the week to 30 June. The spike is attributed to an outbreak at a local meat processing plant.
The government announced it was re-imposing lockdown measures in Leicester on Monday, after a jump in cases last week. New figures released on Thursday show Leicester still had the highest infection rate in England - with 141 cases per 100,000 people in the week to 28 June.
The BBC's Head of Statistics, Robert Cuffe, said Bradford had the next highest case rate in England, but had seen cases fall from 73 to 46 per 100,000 people, less than a third of Leicester's total.
A full list of infection rates for local areas is at the bottom of the page.
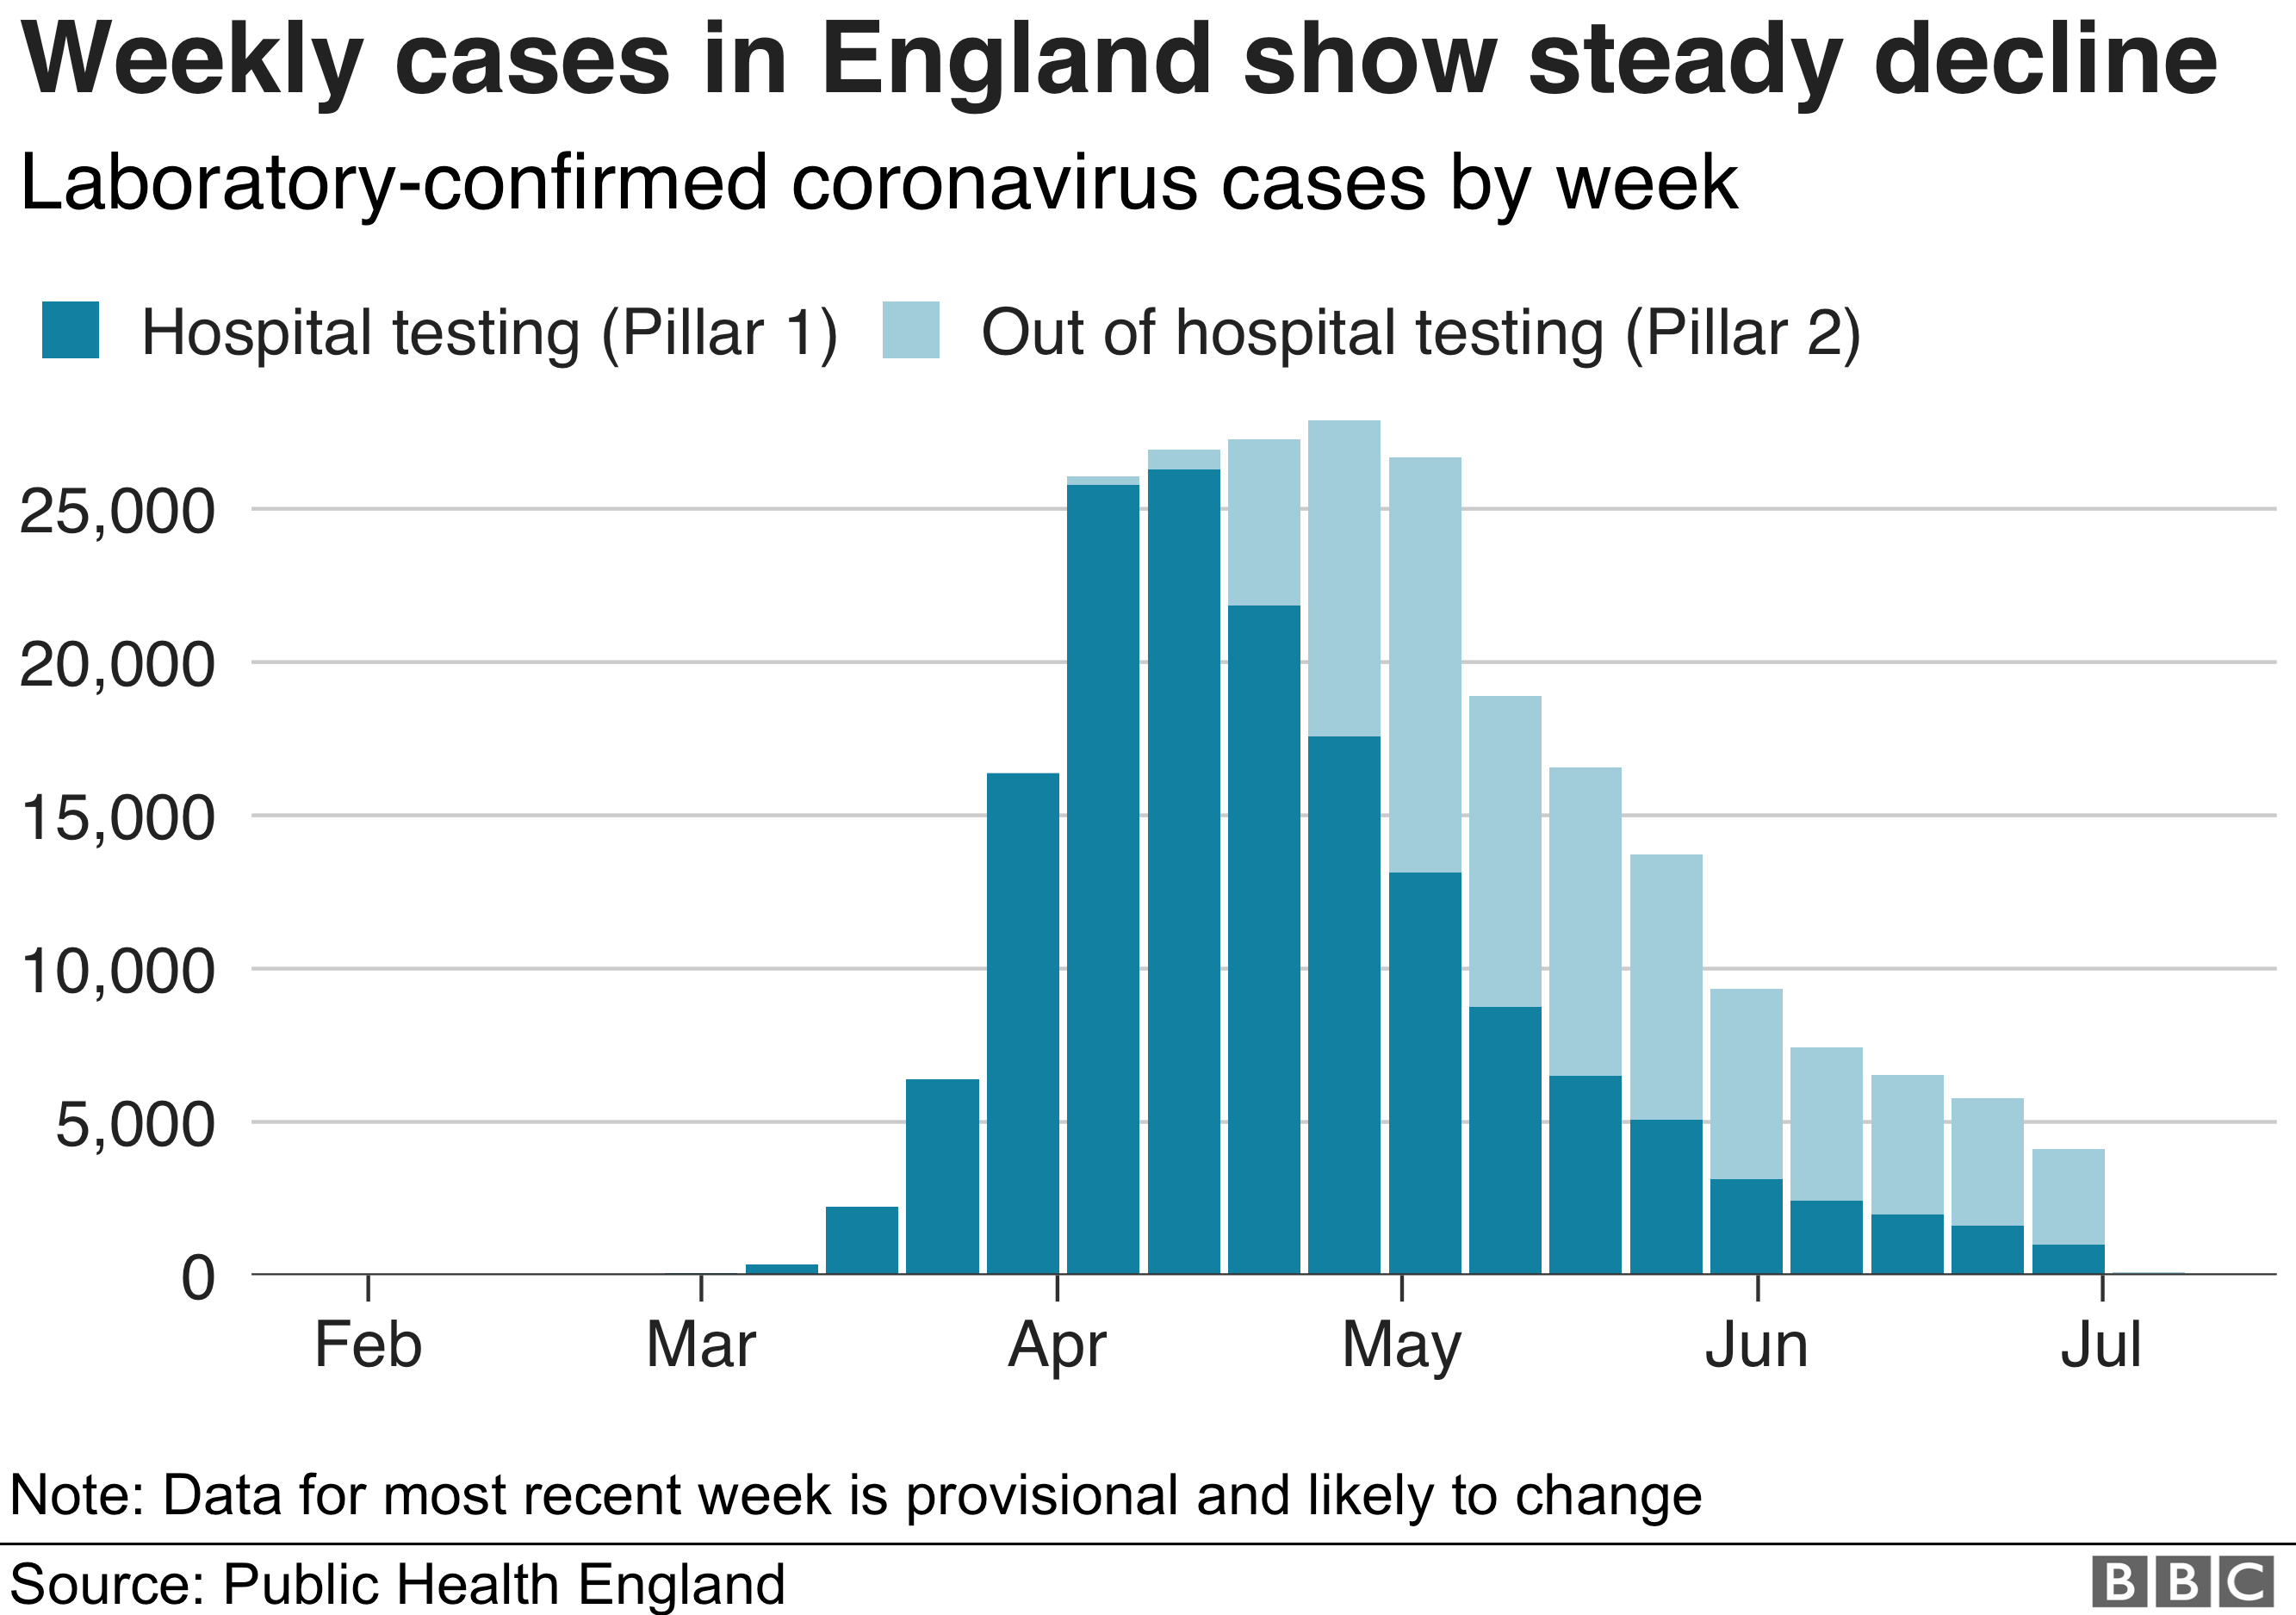
Until recently, the only figures available to local authorities were the results of hospital testing. However, more testing is now taking place in the wider community.
The Department of Health says a data-sharing agreement has now been reached with local authorities, which will give them access to the number of people testing positive in the community in their area.
It should mean that new hotspots can be quickly identified and measures taken to restrict the spread of the disease.
The chart below shows how the growth in community testing (pale blue) has become more significant as positive hospital test results (dark blue) have declined.
But new figures show many people in England are still waiting longer than 24 hours for their results from coronavirus tests carried out at mobile units and regional drive-thru centres.
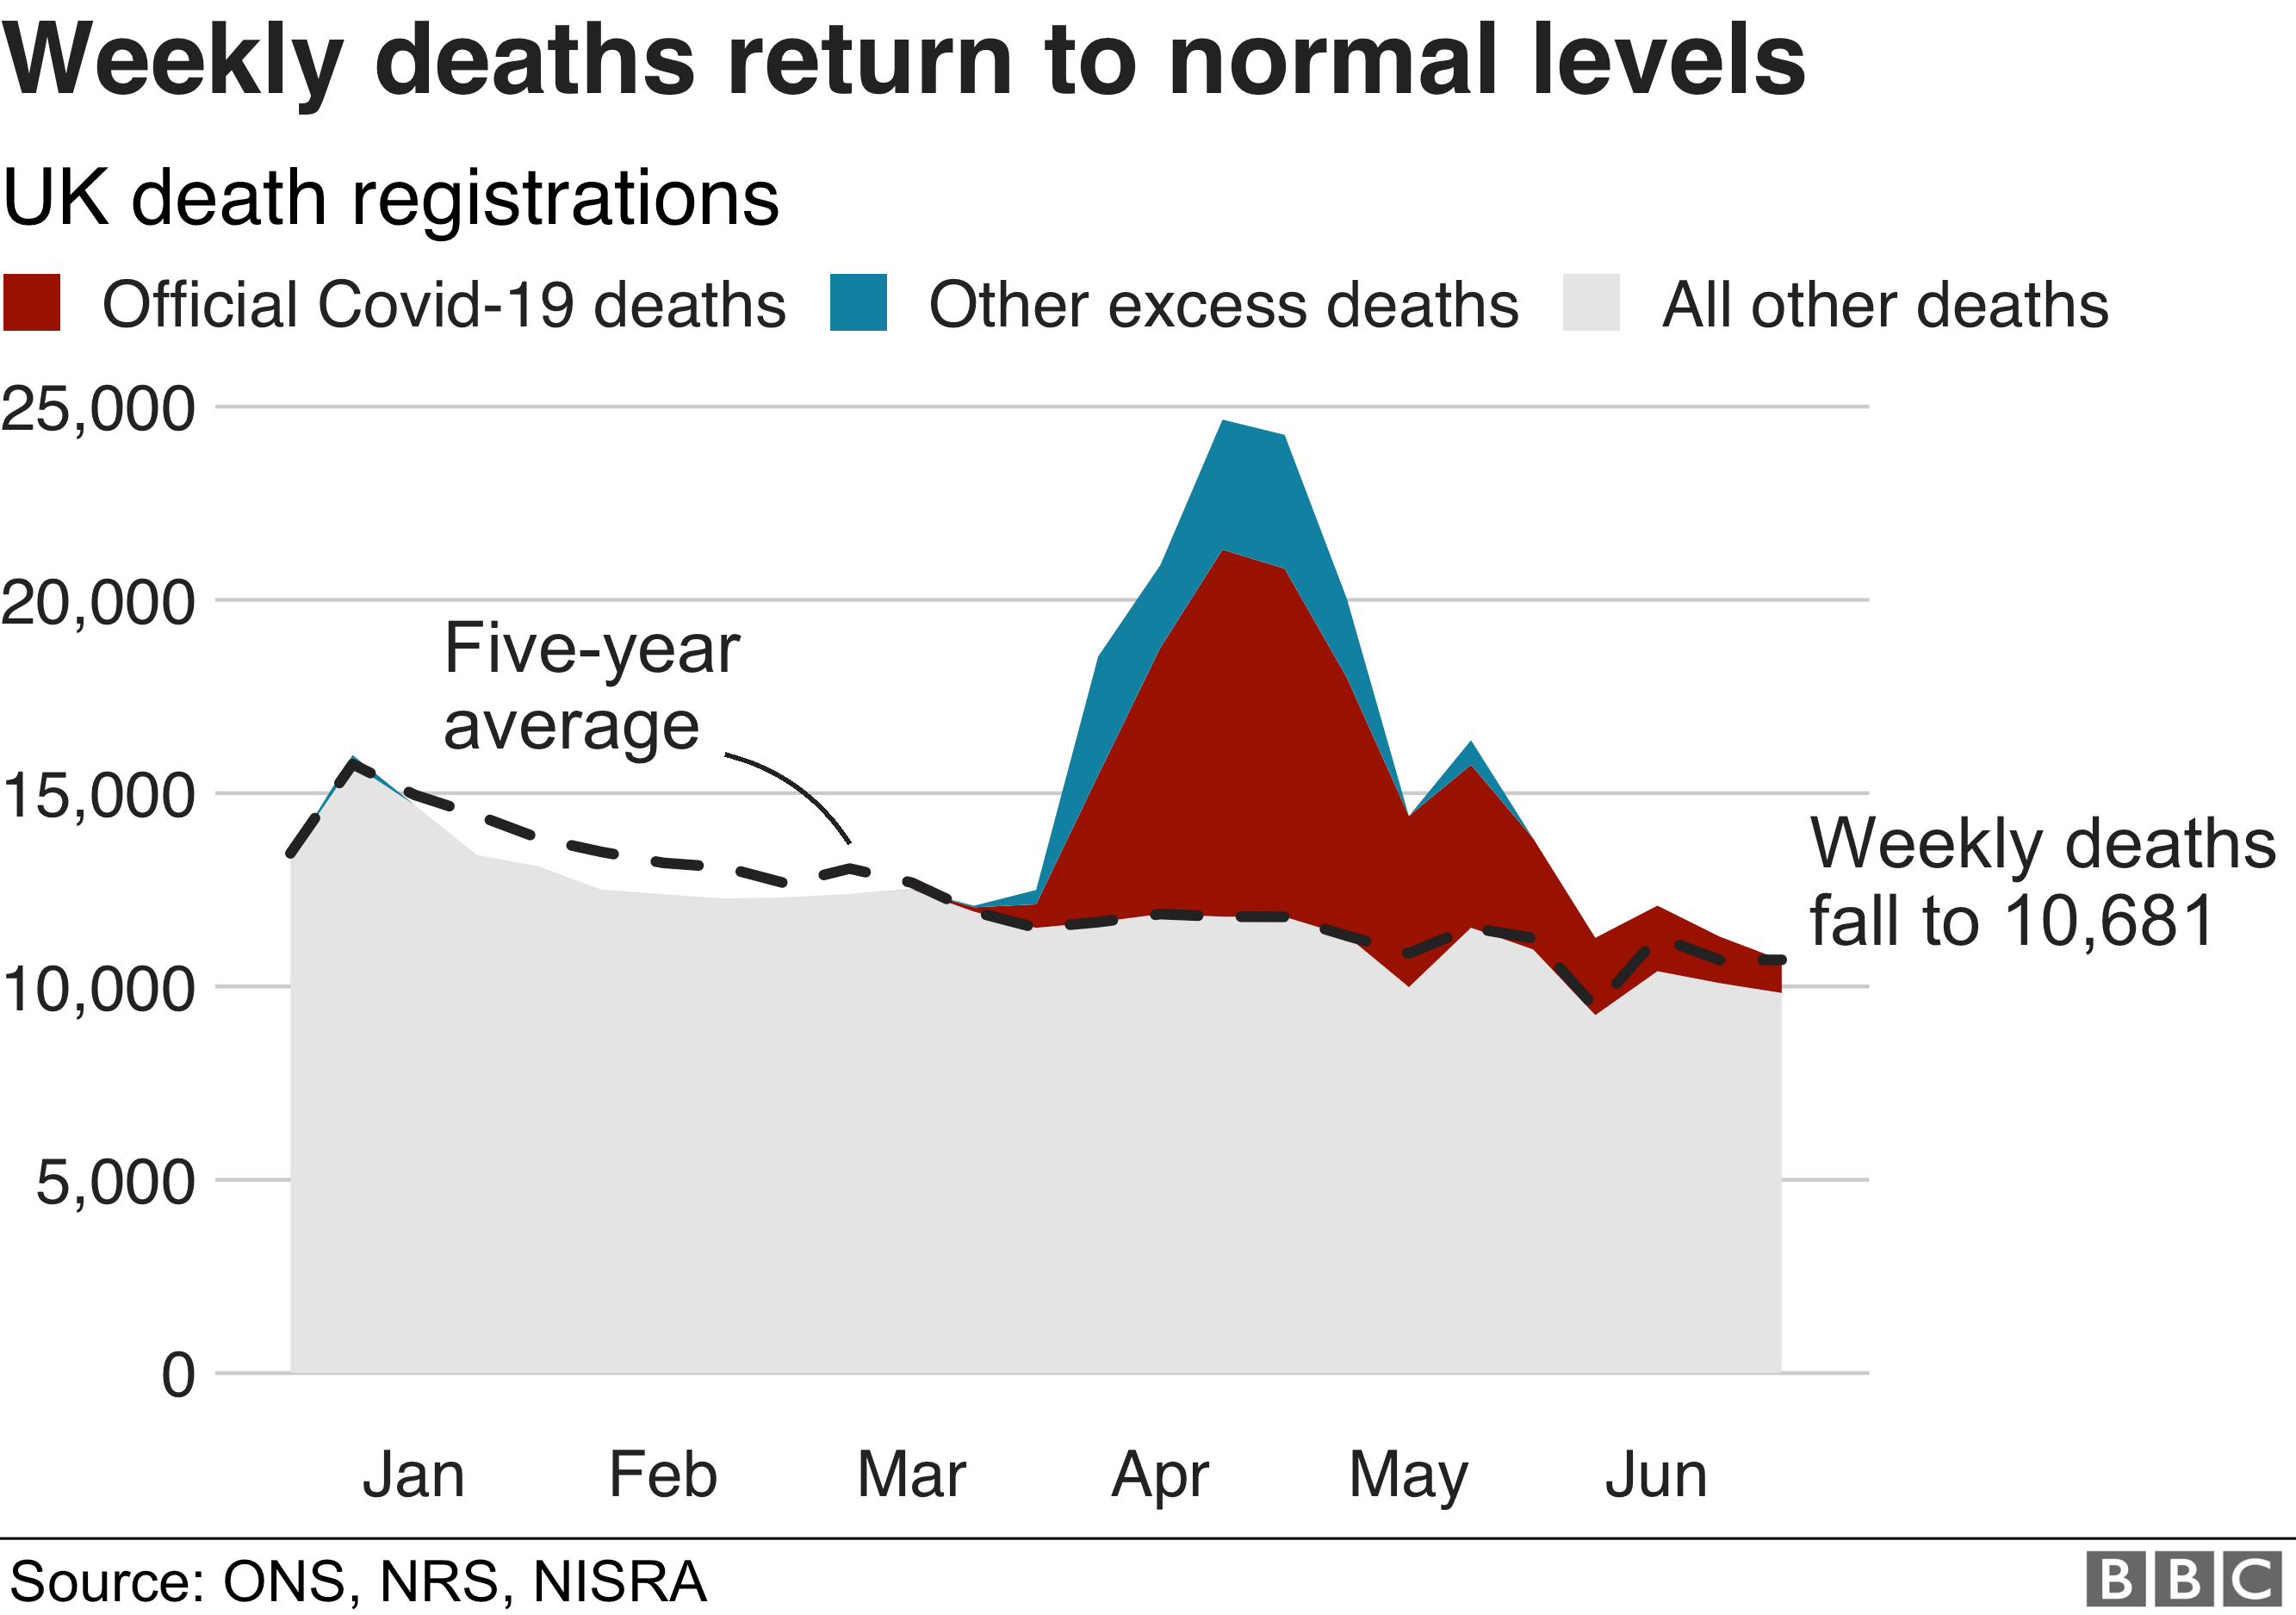
Figures released by the Office for National Statistics (ONS) show the number of deaths from all causes registered in a single week has fallen below the five-year average for the first time since mid-March.
The new coronavirus, which causes the disease Covid-19, was first confirmed in the UK at the end of January, but the number of daily confirmed cases and related deaths only began to increase significantly by the second half of March.
Lockdown restrictions came into force across the UK at the end of that month. The number of new cases came to a peak mid-April and have been falling steadily since.
The number of deaths as a result of the virus can be measured in three ways. The government's daily announcement counts deaths with a positive test result.
But the ONS also counts death certificates mentioning the virus. This measure suggests there had been almost 54,000 deaths by 19 June.
When looking at deaths over and above the expected number for this time of year - the third way of measuring - the coronavirus death toll rises to more than 65,000 by the same date.
Some of these deaths are likely to include people with undiagnosed coronavirus or those who died as an indirect result of the pandemic.
Coronavirus accounted for about 8% of all deaths in the UK in the week to 19 June, according to death registration data - a drop from 11% the previous week.
In the week to 17 April, when deaths from the virus reached their peak, this figure was just under 40%.
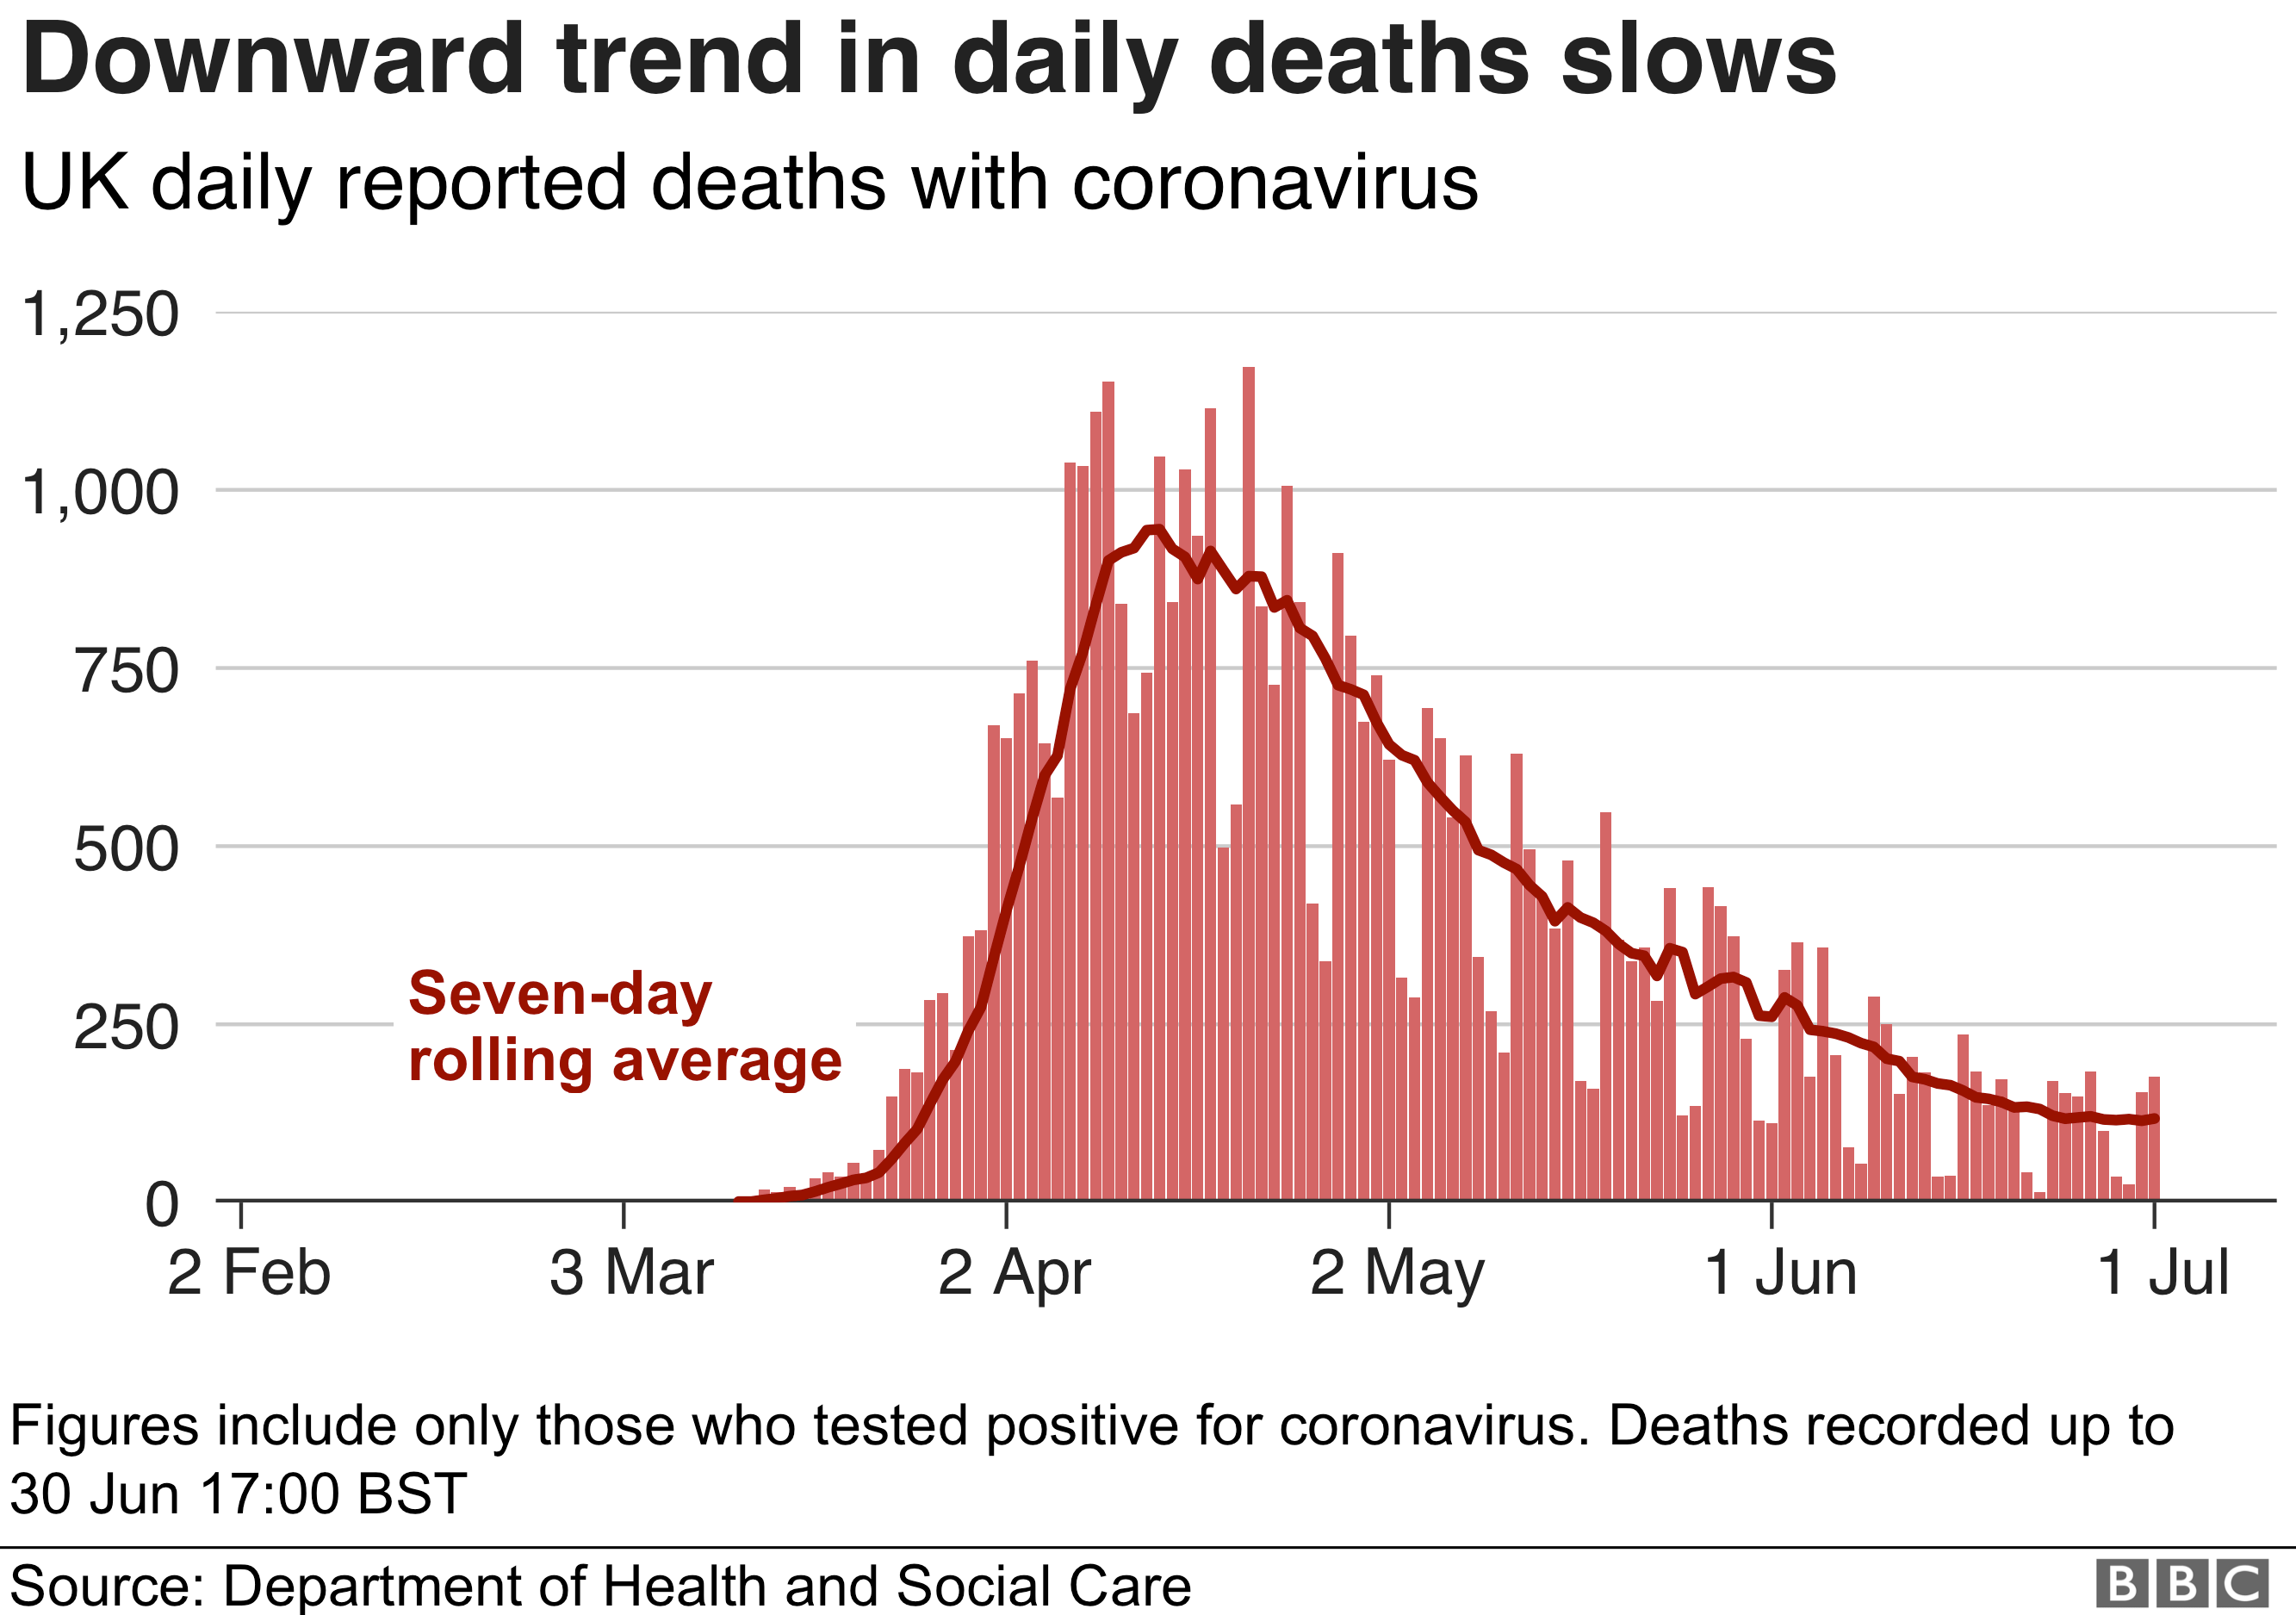
Stall in downward trend of daily deaths
Government-announced deaths from coronavirus peaked mid-April and have been steadily falling since, though the downward trend seems to have slowed in recent days.
On Wednesday, the government announced a further 176 deaths in the UK.
The UK has the highest official death toll in Europe and the third highest in the world, after the US and Brazil.
The government has argued it is too soon to make definitive international comparisons but, as the impact of the first wave becomes clear in many countries, analysis is beginning to suggest the UK has been the hardest hit of the leading G7 nations.
The majority of the UK's deaths have been in England, with about 39,000 so far - around 90% of the total for the UK.
Scotland reported one death on Thursday, taking the overall death toll to 2,487. Data on death registrations from the National Records of Scotland (NRS) suggests there had been 4,155 deaths by 28 June.
The NRS says the number of people dying in Scotland in the week to 28 June was slightly below the five-year average, representing a return to normal levels for the first time since the pandemic began.
Wales has recorded 1,524 deaths and Northern Ireland 552.
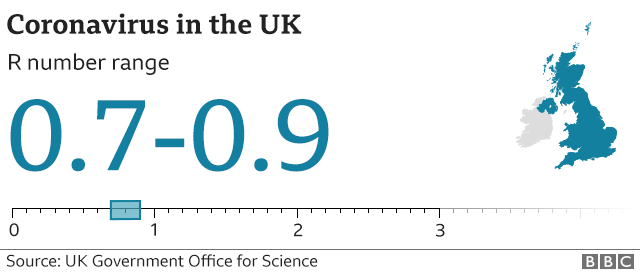
What is the R number in the UK?
The "R number" is the average number of people an infected person will pass the disease on to.
If R is below one, then the number of people contracting the disease will fall; if it is above one, the number will grow.
The Scientific Advisory Group for Emergencies, known as Sage, believes the R number across the whole of the UK is currently between 0.7 and 0.9.
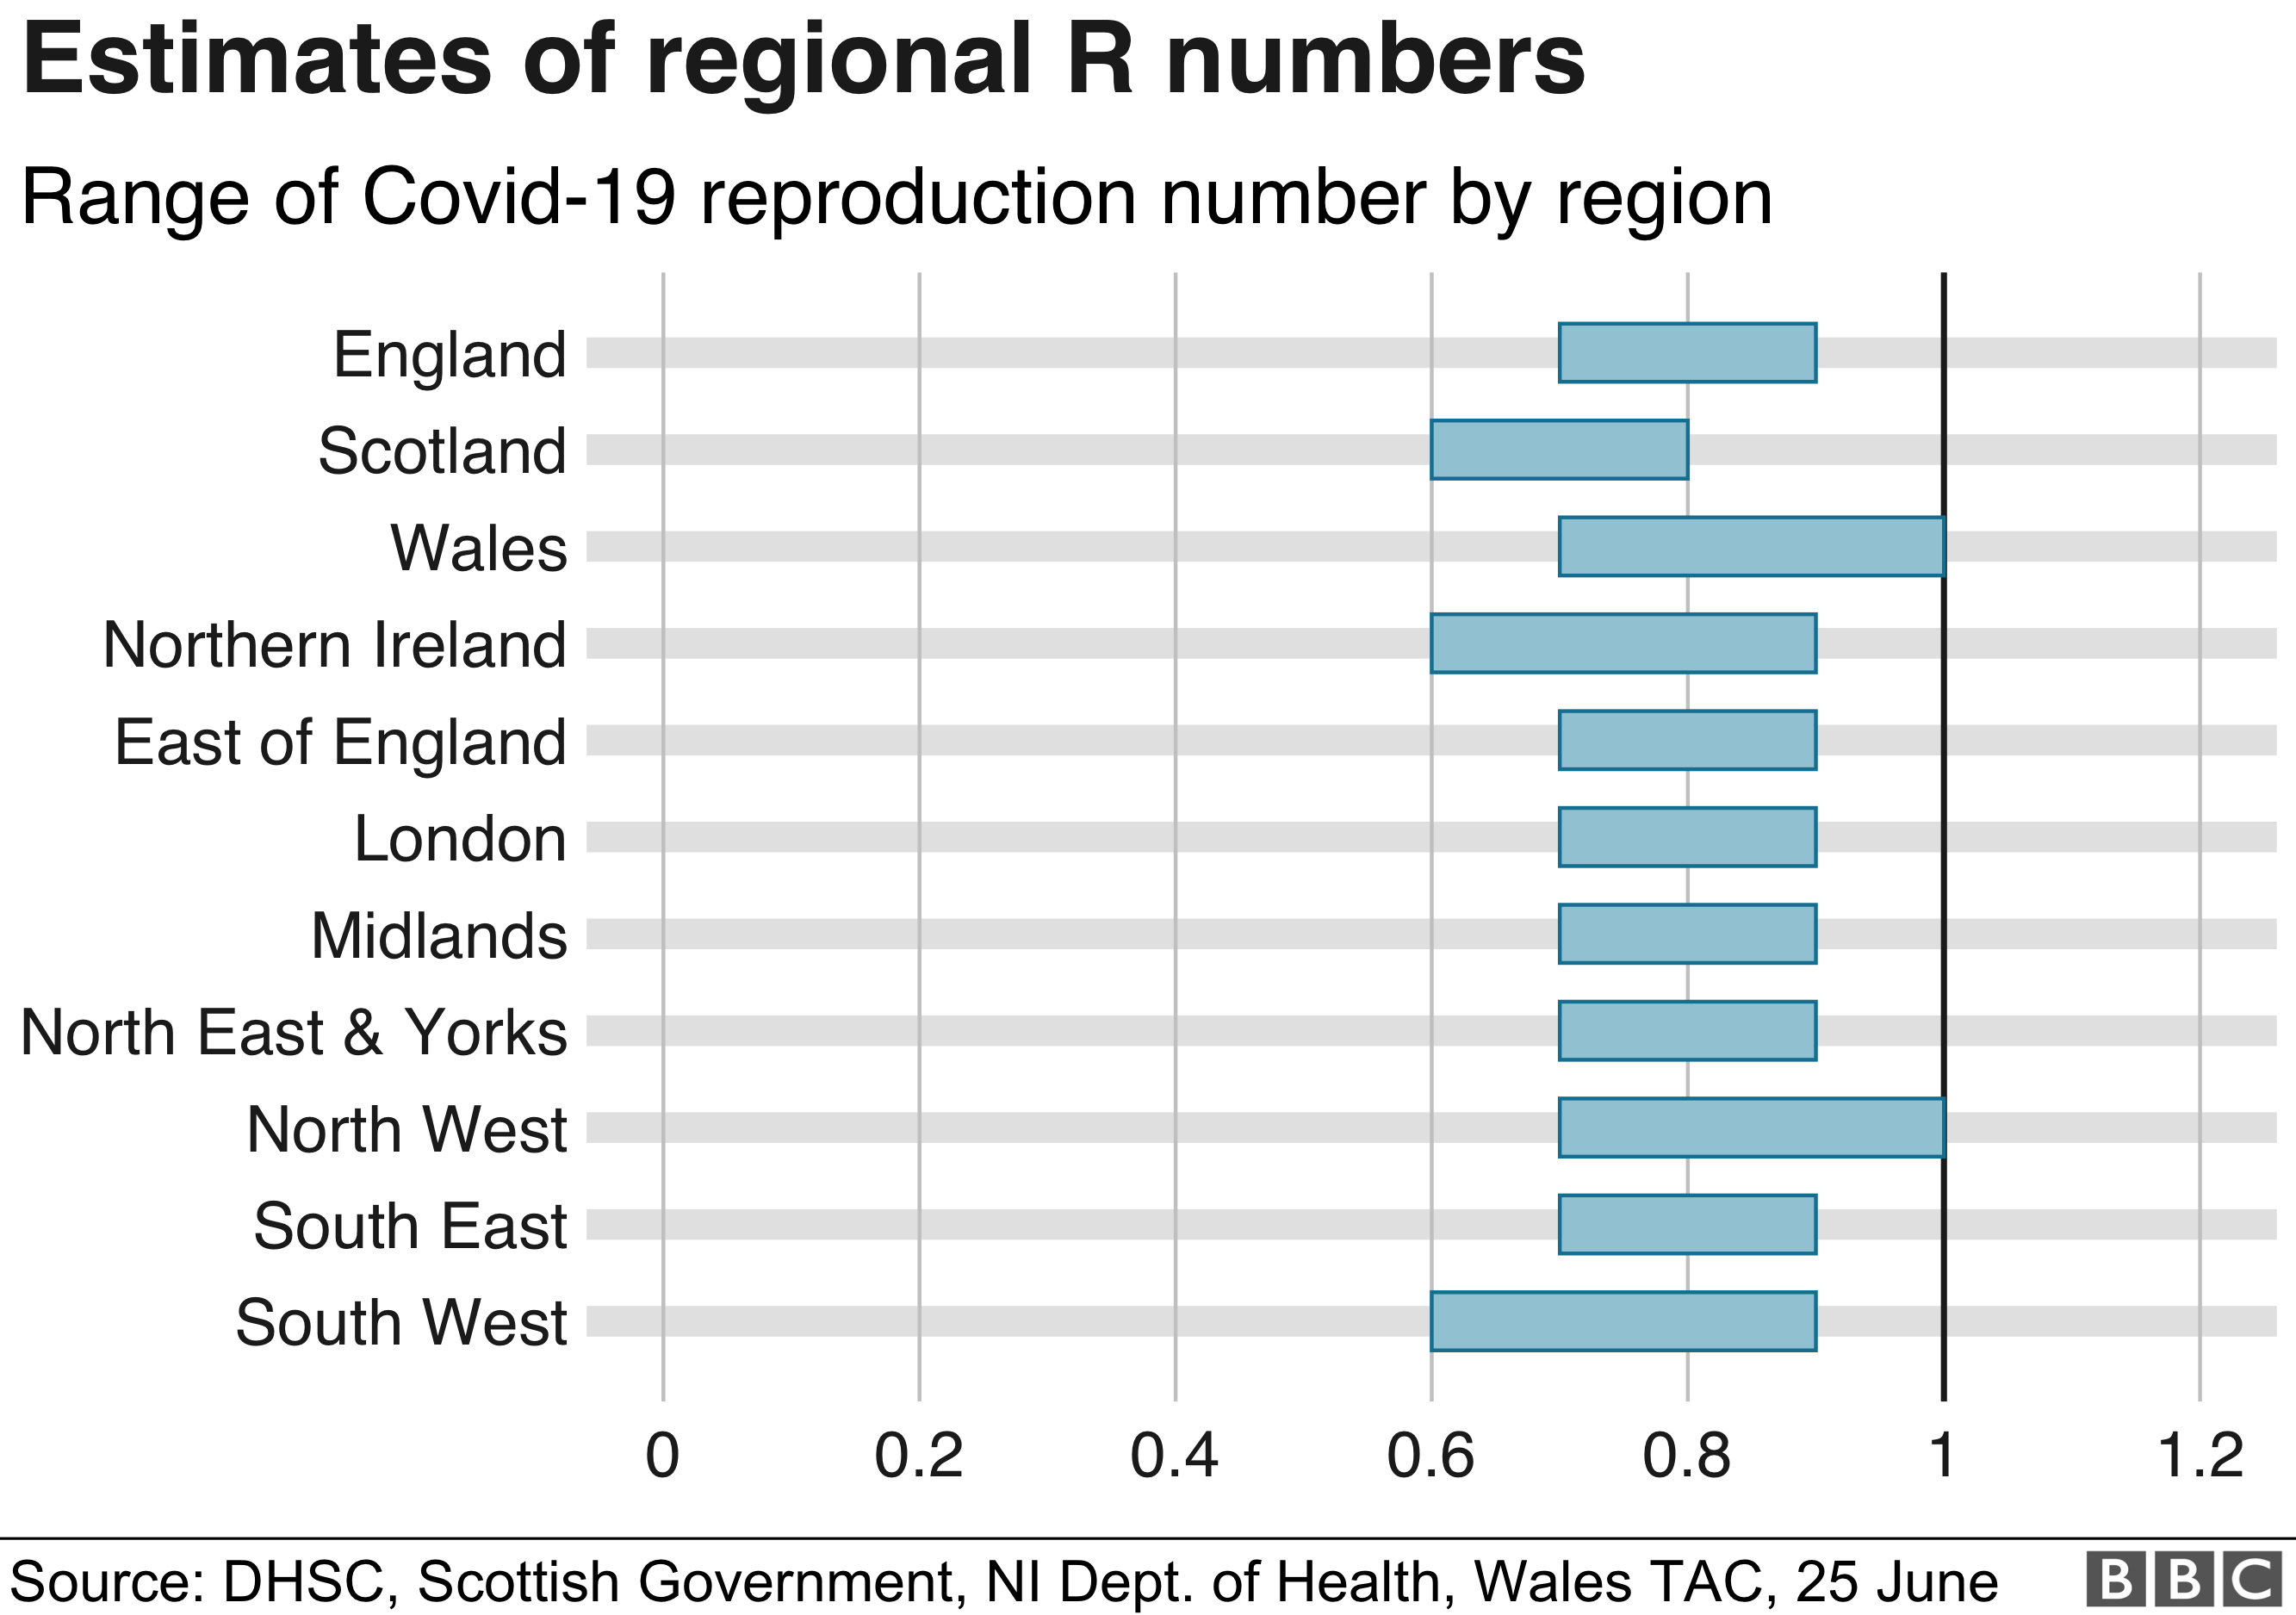
The government says England itself is also between 0.7 and 0.9, but slightly higher in the North West, where it's between 0.7 and 1.0.
The estimate for Scotland is between 0.6 and 0.8. In Northern Ireland, it is between 0.6 and 0.9, while it is between 0.7 and 1.0 in Wales.
The government has said that the R number is one of the most important factors in deciding when lockdown measures can be eased.
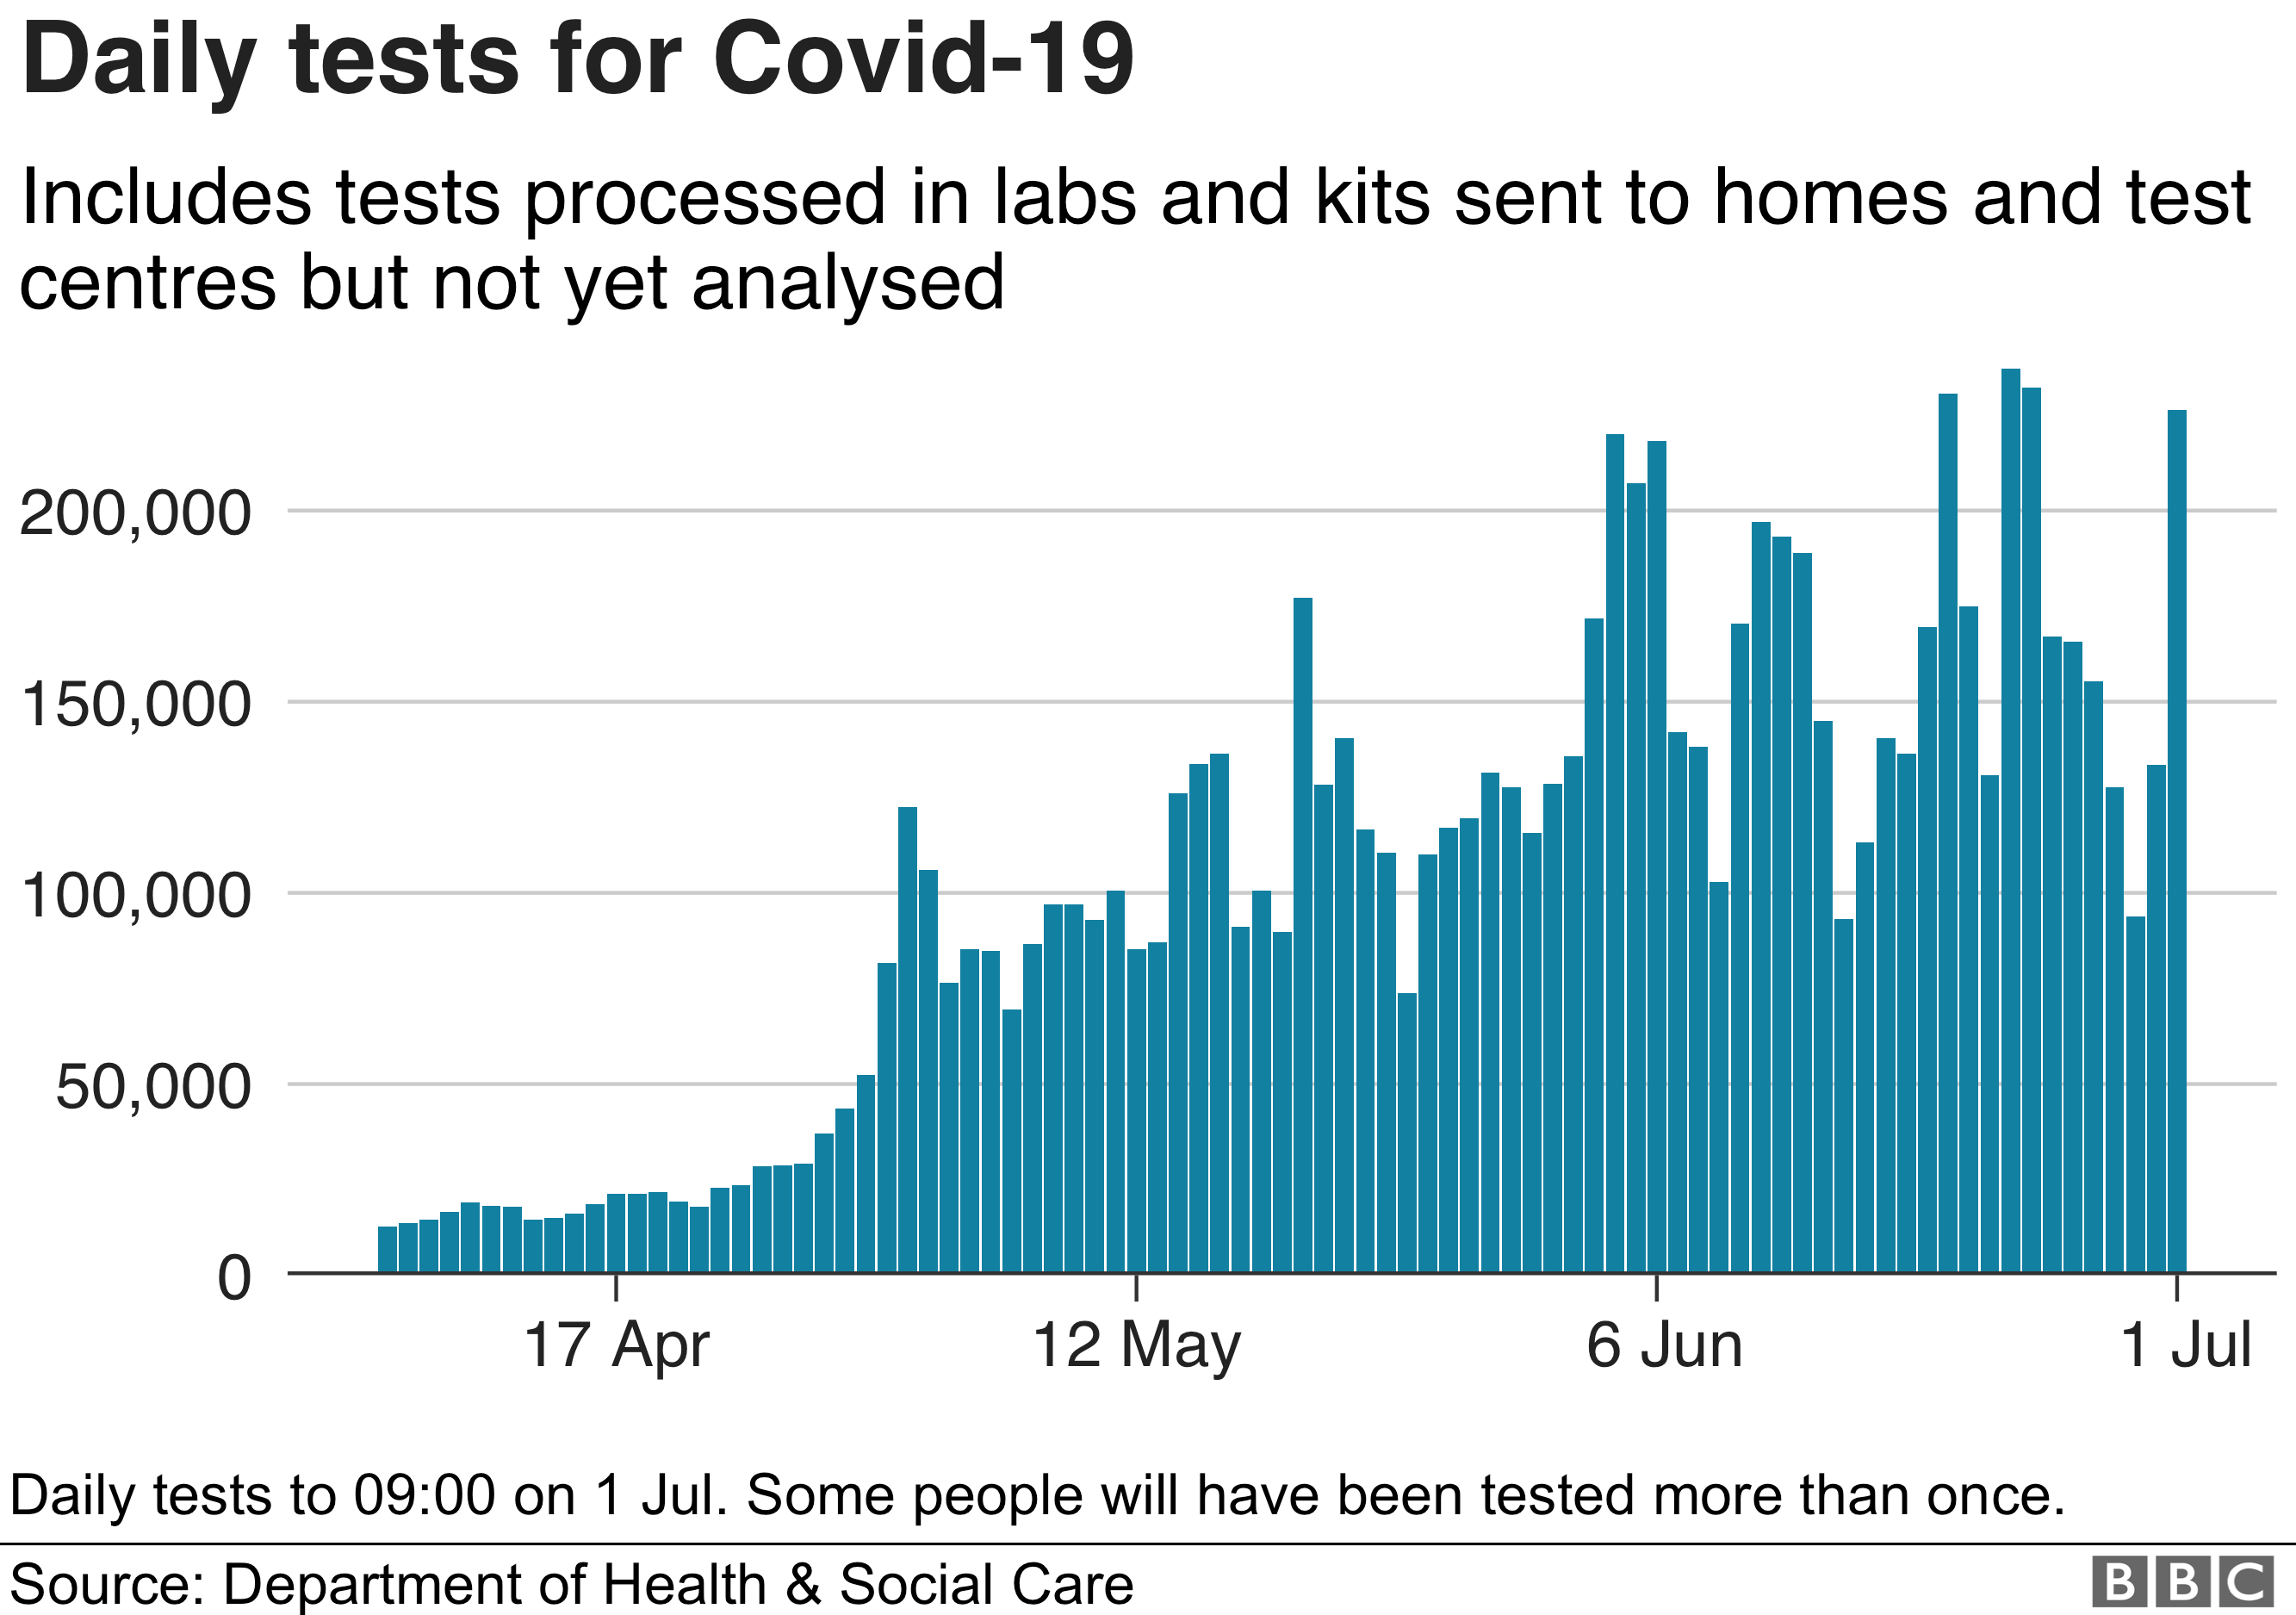
Testing now available to more people
The UK exceeded its target to increase testing capacity to 200,000 a day by the end of May.
However, the UK Statistics Authority has criticised how the data has been presented, saying the aim appeared to be to show "the largest possible number of tests, even at the expense of understanding".
Health Secretary Matt Hancock has said he would look at ways the information could be "improved".
The government announced there were 226,398 tests processed or posted in the 24 hours to 09:00 on Wednesday. This figure does not represent the number of people tested, as some are tested more than once.
At least two million people have been tested for coronavirus in the UK - but the government has been unable to provide an updated figure for the total number of people tested since 22 May.
Who is most at risk from coronavirus?
Most recorded coronavirus deaths have been among the elderly, with NHS England figures showing more than half of deaths have been among people aged over 80.
The disease appears to disproportionally affect men in their 50s and 60s, and the death rate for men outstrips women across all age ranges.
People with underlying health conditions are also at greater risk regardless of age.
Research by Public Health England (PHE) has also found that people from ethnic minorities have a much higher risk of dying from coronavirus than people of white British ethnicity. But it is still not clear why - the study did not take into account occupations or obesity, which are also known to be high risk factors.
Another study found that South Asian people were the most likely to die from coronavirus after being admitted to hospital. It is the only ethnic group to have a raised risk of death in hospital, which researchers believe is partly due to high levels of diabetes.
The most deprived parts of England and Wales have been hit twice as hard by coronavirus as wealthier areas, according to the ONS. Urban areas were worse affected than rural areas and London had significantly more deaths from coronavirus per 100,000 people than any other region, when standardised for age.
Most hospitals seeing fewer coronavirus patients
The number of people in hospital with Covid-19 has been gradually declining since a peak over Easter.
However, the picture is different across the UK's nations and regions, with numbers falling faster in some areas than others.
Infection rates by area
Here's a full list so you can see whether the number of people testing positive per 100,000 in your area has gone up or down.
Infection rates by local authority
Number of cases per 100,000 over seven days
Local authority Infection rate Previous week
Antrim and Newtownabbey 0 4.21
Ards and North Down 2.49 0
Armagh City Banbridge Craigavon 0.47 0
Ayrshire and Arran 1.08 1.62
Barking and Dagenham 5.66 1.42
Barnet 1.53 2.3
Barnsley 35.07 54.65
Bath and North East Somerset 0 1.04
Bedford 18.06 41.95
Belfast 1.17 1.17
Bexley 3.24 4.45
Birmingham 6.48 9.64
Blackburn with Darwen 20.81 32.9
Blackpool 13.64 10.77
Blaenau Gwent 1.43 7.16
Bolton 23.48 15.77
Borders -0.87 0.87
Bournemouth Christchurch Poole 1.01 1.26
Bracknell Forest 1.64 4.11
Bradford 45.8 69.44
Brent 5.44 5.14
Bridgend 1.36 2.04
Brighton and Hove 2.41 5.17
Bristol, City of 1.94 1.94
Bromley 0.6 2.11
Buckinghamshire 3.52 6.11
Bury 6.31 13.15
Caerphilly 1.1 3.31
Calderdale 14.76 12.38
Cambridgeshire 3.68 5.07
Camden 0.38 1.91
Cardiff 6 7.09
Carmarthenshire 6.89 4.77
Causeway Coast and Glens 0.69 3.47
Central Bedfordshire 5.64 15.87
Ceredigion 1.38 8.25
Cheshire East 11.29 16.02
Cheshire West and Chester 9.69 12.33
City of London 0 0
Conwy 11.95 21.33
Cornwall and Isles of Scilly 1.41 0.7
County Durham 4.55 5.12
Coventry 1.36 5.73
Croydon 2.85 1.56
Cumbria 3.61 5.81
Darlington 0.94 4.69
Denbighshire 5.22 15.67
Derby 12.83 24.5
Derbyshire 6.53 9.67
Derry City and Strabane 0 0
Devon 0.38 1.01
Doncaster 21.25 17.39
Dorset 1.06 1.06
Dudley 2.18 3.74
Dumfries and Galloway 4.03 7.39
Ealing 6.73 4.09
East Riding of Yorkshire 4.71 14.13
East Sussex 4.51 9.02
Eileanan Siar (Western Isles) 0 0
Enfield 3.59 2.7
Essex 3.52 5.82
Fermanagh and Omagh 0 0.86
Fife 0.54 0
Flintshire 5.77 13.45
Forth Valley 2.94 3.26
Gateshead 0.49 3.46
Gloucestershire 0.95 0.63
Grampian 1.37 0.68
Greater Glasgow and Clyde 2.03 2.03
Greenwich 2.45 3.14
Gwynedd 5.62 38.54
Hackney 1.43 2.5
Halton 6.23 6.23
Hammersmith and Fulham 12.4 5.93
Hampshire 0.44 1.24
Haringey 2.96 2.59
Harrow 2.8 1.6
Hartlepool 6.43 4.29
Havering 5.43 1.94
Herefordshire 1.56 2.08
Hertfordshire 2.36 4.64
Highland 0.31 0.31
Hillingdon 5.91 2.62
Hounslow 9.23 7.39
Isle of Anglesey 9.99 108.5
Isle of Wight 2.12 2.83
Islington 0.84 2.93
Kensington and Chelsea 6.4 7.68
Kent 10.01 13.45
Kingston upon Hull 3.84 22.64
Kingston upon Thames 1.71 1.14
Kirklees 26.21 30.31
Knowsley 20.06 6.02
Lambeth 0.31 0.92
Lanarkshire 1.36 5.59
Lancashire 7.44 15.04
Leeds 11.66 19.77
Leicester 141.32 140.2
Leicestershire 17.33 20.77
Lewisham 1.65 1.98
Lincolnshire 3.04 5.69
Lisburn and Castlereagh 3.46 2.77
Liverpool 7.68 6.26
Lothian 0.11 2.97
Luton 14.95 26.62
Manchester 17.53 21.55
Medway 4.68 6.12
Merthyr Tydfil 179.03 9.95
Merton 5.82 4.36
Mid and East Antrim 1.44 5.04
Mid Ulster 0 0.68
Middlesbrough 6.4 7.83
Milton Keynes 4.1 10.8
Monmouthshire 3.17 2.11
Neath Port Talbot 1.4 2.79
Newcastle upon Tyne 3.66 5.33
Newham 1.7 3.41
Newport 1.94 0
Newry, Mourne and Down 1.11 2.78
Norfolk 1.55 4.32
North East Lincolnshire 1.88 1.88
North Lincolnshire 3.49 4.65
North Somerset 3.74 1.4
North Tyneside 2.91 4.85
North Yorkshire 5.04 13.83
Northamptonshire 9.9 14.85
Northumberland 2.19 3.43
Nottingham 8.46 10.57
Nottinghamshire 5.35 12.63
Oldham 30.13 38.62
Orkney 0 0
Oxfordshire 4.36 5.09
Pembrokeshire 0.79 0.79
Peterborough 18.9 27.86
Plymouth 2.28 1.52
Portsmouth 0 0.93
Powys 1.51 3.02
Reading 3.06 1.84
Redbridge 2.3 3.62
Redcar and Cleveland 5.12 0.73
Rhondda Cynon Taf 3.73 7.46
Richmond upon Thames 3.05 1.02
Rochdale 35 53.64
Rotherham 26.07 33.63
Rutland 0 2.52
Salford 7.86 10.22
Sandwell 5.5 7.33
Sefton 4.72 8.35
Sheffield 24.38 20.6
Shetland 0 0
Shropshire 7.18 13.74
Slough 8.72 13.41
Solihull 6.51 4.65
Somerset 0.89 4.65
South Gloucestershire 0.71 0.35
South Tyneside 0.67 0
Southampton 0.4 5.54
Southend-on-Sea 8.22 20.83
Southwark 1.58 3.47
St. Helens 6.66 6.66
Staffordshire 7.88 9.37
Stockport 6.51 12.34
Stockton-on-Tees 5.58 14.7
Stoke-on-Trent 14.07 17.98
Suffolk 0.92 1.45
Sunderland 1.8 1.8
Surrey 2.94 3.7
Sutton 1.47 1.96
Swansea 0 0.4
Swindon 6.76 10.36
Tameside 16.87 33.3
Tayside 1.2 0.96
Telford and Wrekin 5.06 8.44
Thurrock 6.96 12.17
Torbay 0 0.74
Torfaen 2.13 0
Tower Hamlets 0.94 2.83
Trafford 3.81 10.15
Vale of Glamorgan 2.99 11.98
Wakefield 8.98 18.55
Walsall 3.18 4.59
Waltham Forest 4.7 5.42
Wandsworth 3.98 2.76
Warrington 5.73 9.07
Warwickshire 5.6 10.33
West Berkshire 1.26 0
West Sussex 2.91 3.26
Westminster 4.7 5.09
Wigan 4.6 5.52
Wiltshire 1.41 1.2
Windsor and Maidenhead 0.66 1.99
Wirral 8.35 19.18
Wokingham 2.98 0.6
Wolverhampton 7.63 9.92
Worcestershire 3.55 5.74
Wrexham 38.25 98.56
York 1.91 6.67
Figures for England 22-28 Jun, Scotland and Northern Ireland 25 Jun - 1 Jul, Wales 24-30 Jun.
Source: Public Health England
| Thumbs Up |
| Received: 26,234 Given: 43,774 |
Of particular note is how, over the last month, the overall death rate has been at or below average. Moreover, even before then, the overall number of deaths involving people below 40 years of age was no higher than normal.
There are currently 1 users browsing this thread. (0 members and 1 guests)
 United Kingdom
 United States
 Posting Permissions


 Reply With Quote
Bookmarks