

0


| Thumbs Up/Down |
| Received: 7/0 Given: 0/0 |
Last edited by hereward; 06-06-2010 at 04:03 PM.
| Thumbs Up/Down |
| Received: 7/0 Given: 0/0 |
| Thumbs Up/Down |
| Received: 7/0 Given: 0/0 |
In this study, we analysed almost 250,000 SNPs from a total of 945 samples from Eastern and Western Finland, Sweden, Northern Germany and Great Britain complemented with HapMap data. Small but statistically significant differences were observed between the European populations (FST = 0.0040, p<10−4), also between Eastern and Western Finland (FST = 0.0032, p<10−3). The latter indicated the existence of a relatively strong autosomal substructure within the country, similar to that observed earlier with smaller numbers of markers. The Germans and British were less differentiated than the Swedes, Western Finns and especially the Eastern Finns who also showed other signs of genetic drift. This is likely caused by the later founding of the northern populations, together with subsequent founder and bottleneck effects, and a smaller population size. Furthermore, our data suggest a small eastern contribution among the Finns, consistent with the historical and linguistic background of the population.
http://www.plosone.org/article/info:...l.pone.0003519


| Thumbs Up/Down |
| Received: 30/3 Given: 0/0 |
Show me a map.Originally Posted by Cail

I could write 10 pages on the Khoi-San.dating back to 50.000 years ago.
The Khoi are a "pure race". The Bantu is not
I admire those who fight for a cause and despise those who cause fights.
When in doubt, make a fool of yourself. There is a microscopically thin line between being brilliantly creative and acting like the most gigantic idiot on earth. So what the hell, leap.
| Thumbs Up/Down |
| Received: 7/0 Given: 0/0 |
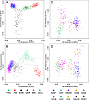
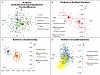
Using principal component (PC) analysis, we studied the genetic constitution of 3,112 individuals from Europe as portrayed by more than 270,000 single nucleotide polymorphisms (SNPs) genotyped with the Illumina Infinium platform. In cohorts where the sample size was >100, one hundred randomly chosen samples were used for analysis to minimize the sample size effect, resulting in a total of 1,564 samples. This analysis revealed that the genetic structure of the European population correlates closely with geography. The first two PCs highlight the genetic diversity corresponding to the northwest to southeast gradient and position the populations according to their approximate geographic origin. The resulting genetic map forms a triangular structure with a) Finland, b) the Baltic region, Poland and Western Russia, and c) Italy as its vertexes, and with d) Central- and Western Europe in its centre. Inter- and intra- population genetic differences were quantified by the inflation factor lambda (λ) (ranging from 1.00 to 4.21), fixation index (Fst) (ranging from 0.000 to 0.023), and by the number of markers exhibiting significant allele frequency differences in pair-wise population comparisons. The estimated lambda was used to assess the real diminishing impact to association statistics when two distinct populations are merged directly in an analysis. When the PC analysis was confined to the 1,019 Estonian individuals (0.1% of the Estonian population), a fine structure emerged that correlated with the geography of individual counties. With at least two cohorts available from several countries, genetic substructures were investigated in Czech, Finnish, German, Estonian and Italian populations. Together with previously published data, our results allow the creation of a comprehensive European genetic map that will greatly facilitate inter-population genetic studies including genome wide association studies (GWAS).
http://www.plosone.org/article/info:...l.pone.0005472
| Thumbs Up/Down |
| Received: 7/0 Given: 0/0 |
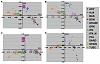
The definition of European population genetic substructure and its application to understanding complex phenotypes is becoming increasingly important. In the current study using over 4,000 subjects genotyped for 300,000 single-nucleotide polymorphisms (SNPs), we provide further insight into relationships among European population groups and identify sets of SNP ancestry informative markers (AIMs) for application in genetic studies. In general, the graphical description of these principal components analyses (PCA) of diverse European subjects showed a strong correspondence to the geographical relationships of specific countries or regions of origin. Clearer separation of different ethnic and regional populations was observed when northern and southern European groups were considered separately and the PCA results were influenced by the inclusion or exclusion of different self-identified population groups including Ashkenazi Jewish, Sardinian, and Orcadian ethnic groups. SNP AIM sets were identified that could distinguish the regional and ethnic population groups. Moreover, the studies demonstrated that most allele frequency differences between different European groups could be controlled effectively in analyses using these AIM sets. The European substructure AIMs should be widely applicable to ongoing studies to confirm and delineate specific disease susceptibility candidate regions without the necessity of performing additional genome-wide SNP studies in additional subject sets.
http://www.ncbi.nlm.nih.gov/pmc/arti...9/?tool=pubmed


| Thumbs Up/Down |
| Received: 2,993/91 Given: 1,102/118 |
| Thumbs Up/Down |
| Received: 2,993/91 Given: 1,102/118 |
| Thumbs Up/Down |
| Received: 7/0 Given: 0/0 |
The Icelandic population has been sampled in many disease association studies, providing a strong motivation to understand the structure of this population and its ramifications for disease gene mapping. Previous work using 40 microsatellites showed that the Icelandic population is relatively homogeneous, but exhibits subtle population structure that can bias disease association statistics. Here, we show that regional geographic ancestries of individuals from Iceland can be distinguished using 292,289 autosomal single-nucleotide polymorphisms (SNPs). We further show that subpopulation differences are due to genetic drift since the settlement of Iceland 1100 years ago, and not to varying contributions from different ancestral populations. A consequence of the recent origin of Icelandic population structure is that allele frequency differences follow a null distribution devoid of outliers, so that the risk of false positive associations due to stratification is minimal. Our results highlight an important distinction between population differences attributable to recent drift and those arising from more ancient divergence, which has implications both for association studies and for efforts to detect natural selection using population differentiation.
http://www.plosgenetics.org/article/...l.pgen.1000505
| Thumbs Up/Down |
| Received: 7/0 Given: 0/0 |
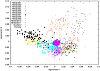
CAPS is SwedishTop axes of genetic variation in the Nordic Control Database (4620 samples) contrasted with the CEU population (108 samples) HapMap and a Finnish reference population (81 samples). The MDS analysis was performed on approximately 45K SNPs that were common between the genotyping platforms. The samples are represented with the color of their country of origin: Finland (red), Sweden (green) and Denmark (yellow). The geographical map is highlighted for comparison.
SGENE & MS are Finnish (Helsinki)
Aneurysm is Finnish (Helsinki and Kupio)
http://www.nordicdb.org/database/Map.html
There are currently 1 users browsing this thread. (0 members and 1 guests)
 Posting Permissions

 Reply With Quote


Bookmarks