

0


| Thumbs Up/Down |
| Received: 84/1 Given: 28/2 |
Don Brick
New World
- US 44.65
- CA 46.81
- AU 48.00
Old World
- FI 16.82
- Chuvash 33.43
- N. RU 33.68
- DE 36.06
- RU 36.46
- UA 39.46
- AT 41.49
- HU 42.48
- FR 42.68
- EE 43.23
(updated with Sahson's calculator fix)
Last edited by Humanophage; 08-19-2011 at 01:17 PM.

| Thumbs Up/Down |
| Received: 1,538/309 Given: 1,428/181 |
Thanks man. I think it's really interesting that according to the chart I am closer to Italians than I am to Greeks. I think it's more likely that there is not enough data or the sample of Greeks are from the very south (Crete, Peloponnese, etc) or I am indeed closer to grand old Romans...Originally Posted by Humanophage


| Thumbs Up/Down |
| Received: 438/31 Given: 0/0 |
Could someone make one for me, NO2?


| Thumbs Up/Down |
| Received: 32/0 Given: 8/1 |
Can I hae wan tae? Its the usual suspects who dinny ken wit tae dae.
Those who do them could start charging a small fee.
UK39


| Thumbs Up/Down |
| Received: 11/1 Given: 0/0 |
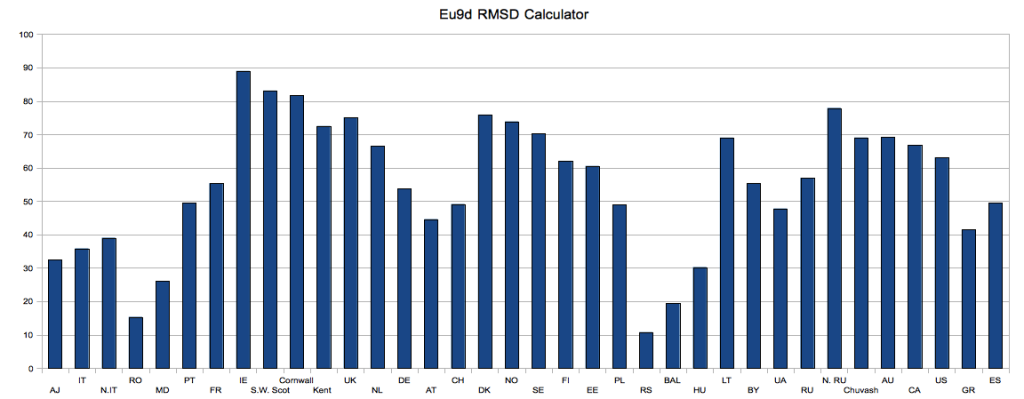
Which spreadsheet are you using? this one looks out of date, check the romanian figures.
This is the one I made for Apothesis, you can see that they are distinctly different.
| Thumbs Up/Down |
| Received: 11/1 Given: 0/0 |
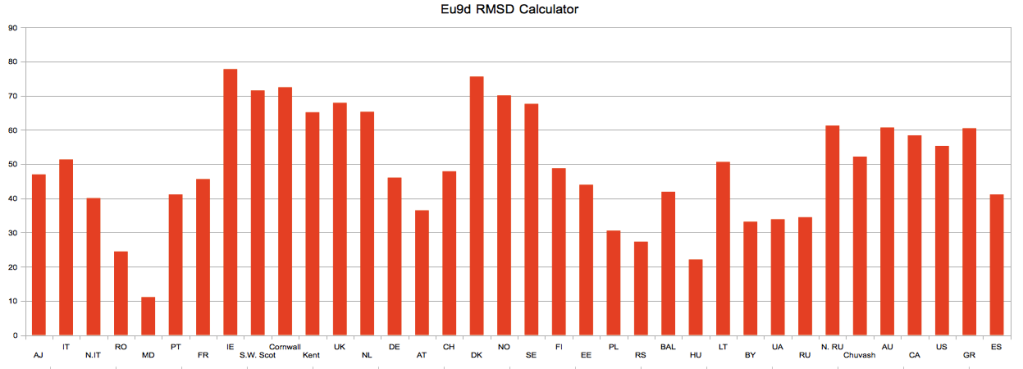
Bastarnae
New World
US 55.29
CA 58.41
AU 60.68
Old World
1. MD 11.06
2. HU 22.08
3. RO 24.41
4. RS 27.29
5. PL 30.54
6. BY 33.14
7. UA 33.84
8. RU 34.46
9. AT 36.45
10. N. IT 40.04
| Thumbs Up/Down |
| Received: 12/3 Given: 0/0 |
I appreciate the help, but to be honest some of the results look pretty... off. Seems that others are using different spreadsheets. Could someone have another go at it? FI6. Thanks a lot.
| Thumbs Up/Down |
| Received: 84/1 Given: 28/2 |
Thank you. Indeed, I was using the first posted spreadsheet, without the fix. I somehow missed it in the flurry of pictures. The changes seem to be:
1) Romanian figures
2) Swiss figures
3) There were no Spanish figures initially
Updated the list, everything save for Romania stayed the same. The results are so high for Chuvash and N. Russians not because of some Asiatic admixtures, which you don't have, but because of your high Finnic admixtures (called 'East European'). If you sort out the EU9 results by 'East European', you will find that only Finns, Chuvash, Russians, and North Russians have such high levels of it. There are individuals like 2 out of 19 Swedes, but they are outliers.
Of course, now that I've lost some credibility, somebody else has to confirm that post. I am quite certain of its accuracy though.
Single Population Sharing (Eurogenes)
1 Estonian_Polish 4.36
2 Russian_Smolensk 4.88
3 Southwest_Russian 5.32
4 Belorussian 5.78
5 Lithuanian 5.92
| Thumbs Up/Down |
| Received: 84/1 Given: 28/2 |
Pallantides
New World
- AU 12.21
- CA 14.06
- US 15.59
Old World
- UK 9.71
- Kent 9.79
- NO 12.30
- NL 16.38
- DE 24.28
- SE 24.40
- Cornwall 24.78
- DK 27.72
- S.W. Scot 31.37
- AT 34.05
(made with Sahson's update)
I'm certain it is hardly surprising for you, Pallantides.
Single Population Sharing (Eurogenes)
1 Estonian_Polish 4.36
2 Russian_Smolensk 4.88
3 Southwest_Russian 5.32
4 Belorussian 5.78
5 Lithuanian 5.92
| Thumbs Up/Down |
| Received: 11/1 Given: 0/0 |
And the dutch, and german's were corrected
There are currently 26 users browsing this thread. (0 members and 26 guests)
 Posting Permissions


 Reply With Quote


Bookmarks