

1


| Thumbs Up/Down |
| Received: 15,680/315 Given: 8,909/358 |
Okay, I hope the generic Dutch for Dodecad is good enough. It is modeled as ca. 60% NW German and 40% Belgian.Originally Posted by Creoda


| Thumbs Up/Down |
| Received: 11,402/53 Given: 6,787/3 |
All it shows is the Belgians collected were like S.Dutch, which is not that crazy, they are random people we don't know anything about for sure, people label themselves how they want on gedmatch/gedcom/forums and many may have ancestry from both sides they don't even know about. The 2 Belgians we have here don't cluster with it so that's a problem, far from it even. "I find it too south" isn't a valid or scientific argument to discard academic samples.
Im talking about the K15 sample which was plain and simple renamed, not a new sample, just falsified, possibly under the same logic.
Original samples vs "updated"
Now i would find W.German too south compared to Belgians. We could go on and on all night like that...


| Thumbs Up/Down |
| Received: 17,554/196 Given: 8,307/117 |
That 'update' (which was just falsely renaming as something else on an MS paint map) has nothing to do with the updated vahaduo averages people have been making on this forum, based on real samples/kits.
The old averages haven't been discarded, they're still there to use. If you think the old South Dutch average and others are more accurate that's up to you, but you're wrong. Being supposedly academic doesn't make them infallible. I agree however that the updated Provence average is ridiculous, but Peterski made the French averages and had his own logic for it.
| Thumbs Up/Down |
| Received: 11,402/53 Given: 6,787/3 |
The vahaduos seem fine in general. Well i missed that "detail" about the Provence sample, that explains it then...


| Thumbs Up/Down |
| Received: 4,863/123 Given: 2,945/0 |
Actually the distance between Latvians and Estonians should be even higher, because for example the FST distance between the Siberian and Baltic components is about 6 times higher than the FST distance between the Baltic and North_Atlantic components. But Vahaduo doesn't take that into account.
The heatmap below shows the 32 populations that are the closest to the Latvian average in the K13 updated spreadsheet (when not accounting for FST distances between the components).
The reason why Latvians are far from their neighbors on your list is that Latvians have a huge amount of the Baltic component. I don't know if it's because Latvians were used as a reference for the Baltic component.
For the clustering, I multiplied the matrix of population percentages with a matrix of the FST distances between the components. Otherwise Finns didn't even end up in the same cluster with North Russians.
Code:library(pheatmap) library(vegan) # for reorder.hclust library(colorspace) # for hex t=read.csv("https://pastebin.com/raw/7CMyn57j",row.names=1,check.names=F) pick=names(head(sort(as.matrix(dist(t))["Latvian",]),32)) t=t[pick,] fst=as.matrix(as.dist(read.csv(row.names=1,check.names=F,text=",North_Atlantic,Baltic,West_Med,West_Asian,East_Med,Red_Sea,South_Asian,East_Asian,Siberian,Amerindian,Oceanian,Northeast_African,Sub-Saharan North_Atlantic,,,,,,,,,,,,, Baltic,19,,,,,,,,,,,, West_Med,28,36,,,,,,,,,,, West_Asian,26,32,36,,,,,,,,,, East_Med,26,35,28,21,,,,,,,,, Red_Sea,52,62,50,48,39,,,,,,,, South_Asian,64,65,76,57,60,82,,,,,,, East_Asian,114,114,122,110,111,127,76,,,,,, Siberian,111,111,123,109,112,130,83,56,,,,, Amerindian,138,137,154,138,144,161,120,113,105,,,, Oceanian,179,181,187,177,176,191,146,166,177,217,,, Northeast_African,122,127,124,116,108,121,113,145,151,185,203,, Sub-Saharan,146,150,150,140,135,141,133,164,170,204,220,41,"))) d=dist(as.matrix(t)%*%fst) d2=as.matrix(d) maxdist=which(d2==max(d2))[1];hc=reorder(hclust(d),d2[,maxdist%/%nrow(d2)+1]-d2[,maxdist%%nrow(d2)]) # hc=reorder(hclust(d),d2[,"East_Finnish"]-d2[,"Bosniak_Bosnia"]) t=t[,order(colMeans(t))] pheatmap::pheatmap( t, filename="a.png", cluster_cols=F, clustering_callback=function(...)hc, legend=F, cellwidth=16, cellheight=16, treeheight_row=80, treeheight_col=80, fontsize=8, border_color=NA, display_numbers=T, number_format="%.0f", fontsize_number=7, number_color="black", # breaks=seq(0,100,100/256), colorRampPalette(hex(HSV(c(210,210,130,60,40,20,0),c(0,rep(.5,6)),1)))(256) )
Last edited by Komintasavalta; 05-25-2021 at 01:54 AM.

| Thumbs Up/Down |
| Received: 434/0 Given: 618/0 |
TITLE OF THE PROJECT: Population Genomic Diversity of France (POPGEN)
Participants will be recruited among CONSTANCES cohort volunteers who agreed transmission of their data and provided information about their parents and grandparents year and place of birth. Among all those individuals, 15,000 will be randomly selected according the following criteria:
- The place of birth of the four grandparents is known and clustered in a restricted geographic area,
- Homogeneous distribution in metropolitan France.
https://www.constances.fr/_assets/_pdf/POPGEN.pdf
i suggest you and everyone interested in the French genetic diversity to track the progress of this study.
Last edited by J.S.; 05-25-2021 at 06:01 AM.
| Thumbs Up/Down |
| Received: 1,950/15 Given: 1,667/4 |
There is no point in posting this, the vast majority of people on apricity are ignorant of French genetics and prefer to read unscientific nonsense created by a Eurasian (https://www.theapricity.com/forum/sh...ygonal-diagram) which states that EEF = wog and less EEF + more "siberian" = less wog
It's totally stupid (besides, he forget the other contributions, like the Neolithic levant, iran farmer, etc.), but that's the mentality of the people of Apricity (98%).
| Thumbs Up/Down |
| Received: 434/0 Given: 618/0 |
cancel


| Thumbs Up/Down |
| Received: 774/0 Given: 951/2 |
Admix Results (sorted):
#PopulationPercent1
Baltic 47.13
North_Atlantic 35.38
Siberian 9.06
West_Med 5.46
Amerindian 1.14
Oceanian 1.03
East_Asian 0.81
Single Population Sharing:
#Population (source)Distance1
Finnish 3.75
East_Finnish 5.18
Southwest_Finnish 6.61
Estonian 7.35
Kargopol_Russian 11.15
Belorussian 11.57
Estonian_Polish 12.02
Polish 12.56
Lithuanian 12.57
Russian_Smolensk 12.73
Southwest_Russian 13.76
South_Polish 13.98
La_Brana-1 14.22
Ukrainian 14.28
North_Swedish 14.29
Erzya 14.83
Ukrainian_Belgorod 14.98
Ukrainian_Lviv 15.15
East_German 19.81
Croatian 20.22
Mixed Mode Population Sharing:
# Primary Population (source)Secondary Population (source)Distance1
97.7%Finnish+2.3%Evens@3.122
97.7%Finnish+2.3%Evenki@3.143
97.6%Finnish+2.4%Dolgan@3.144
97.7%Finnish+2.3%Yakut@3.195
97.7%Finnish+2.3%Koryak@3.246
58.7%East_Finnish+41.3%Southwest_Finnish@3.247
97.2%Finnish+2.8%Selkup@3.278
77.6%East_Finnish+22.4%North_Swedish@3.279
97.9%Finnish+2.1%Oroqen@3.2810
97.2%Finnish+2.8%Ket@3.2811
97.7%Finnish+2.3%Chukchi@3.312
97.8%Finnish+2.2%Tuvinian@3.3913
85.8%East_Finnish+14.2%Norwegian@3.414
98%Finnish+2%Buryat@3.4215
88%East_Finnish+12%West_Scottish@3.4416
87.4%East_Finnish+12.6%Orcadian@3.4417
84.3%East_Finnish+15.7%Swedish@3.4918
97.9%Finnish+2.1%Altaian@3.4919
98.4%Finnish+1.6%East_Greenlander@3.5220
88%East_Finnish+12%Irish@3.53
| Thumbs Up/Down |
| Received: 4,863/123 Given: 2,945/0 |
You have the highest Siberian percent out of Finnish users so far:

There are currently 1 users browsing this thread. (0 members and 1 guests)
 Posting Permissions

 Reply With Quote
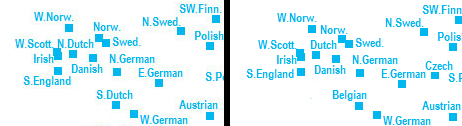

Bookmarks