

2


| Thumbs Up/Down |
| Received: 26/0 Given: 7/0 |
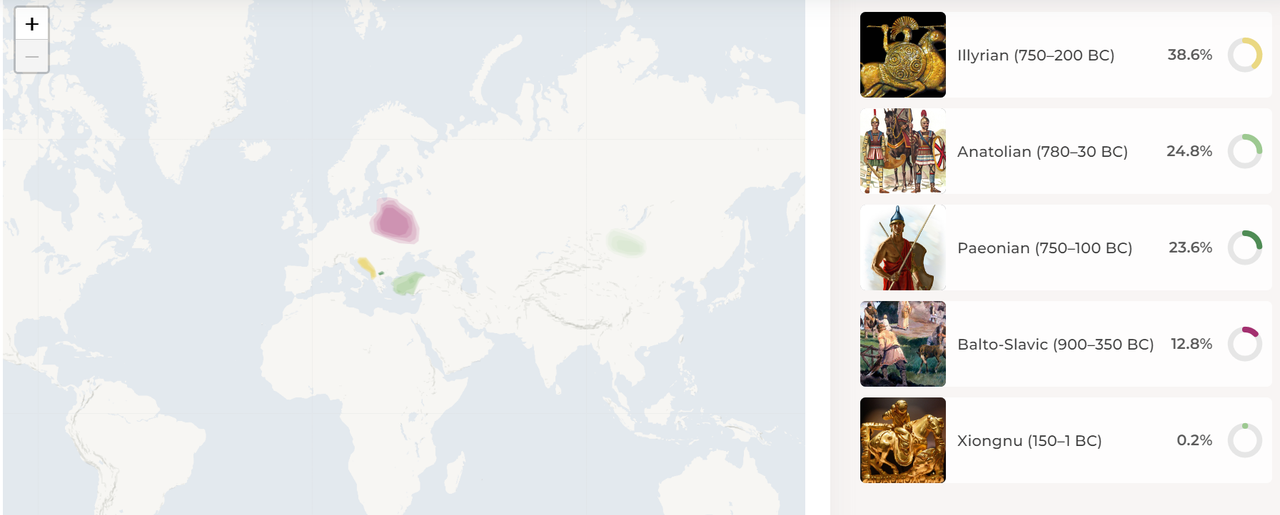
Cannot really believe I paid for this crap, told me nothing new. Gonna delete this crap immediately but whatever. So I got like 62% Illyrian/Paeonian , they are samples that overlap with each other and can be added together. 38.6 Illyrian + 23.6% Paeonian = 62% IA Balkan.
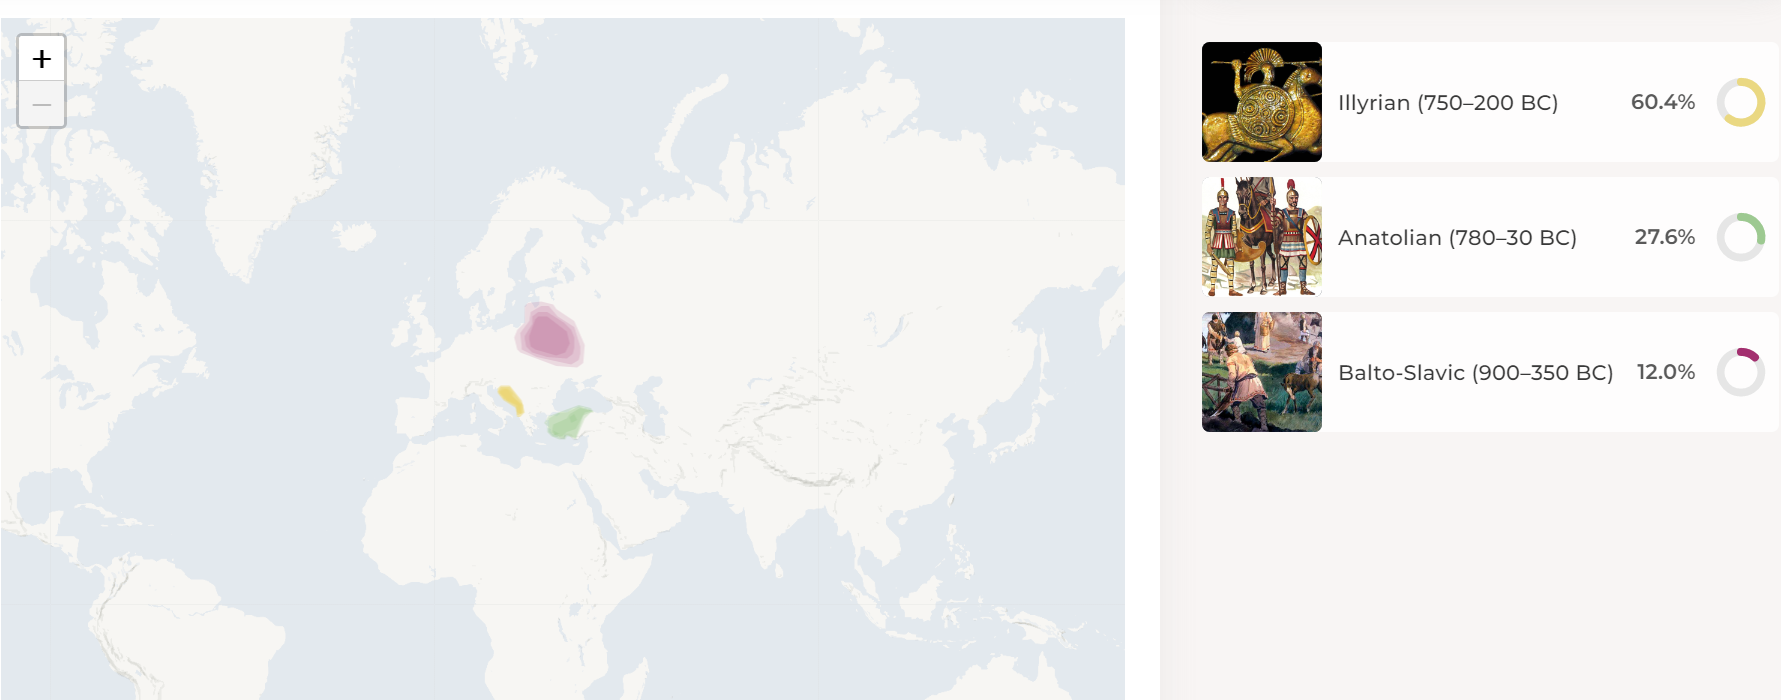
EDIT: Turns out you can change the settings on this thing, so with only 3 ancient populations gives me around 60% Illyrian:
Spoiler!
With Paeonian:
Fit: 0.822 (Very Good)
Spoiler!
Removing Paeonian usually gives more Illyrian or vice versa. One calc I got about 60% Illyrian when Paeonian was removed or the other way around. They could be cousins with Illyrian samples based on snps shared.
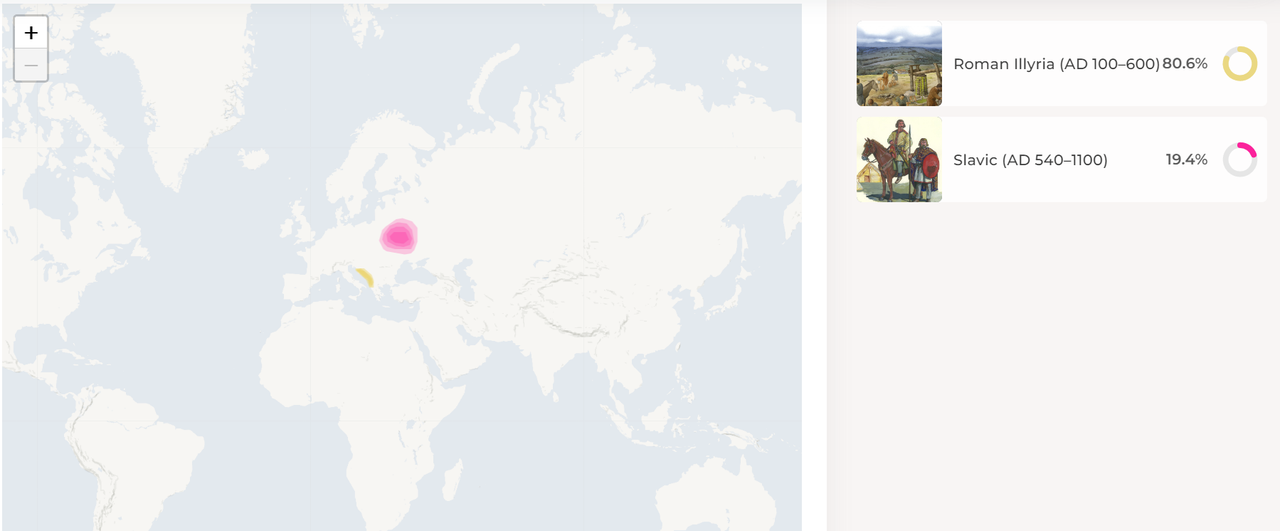
From the Roman period, 80% Roman Illyrian:
Spoiler!
When using Thracian + Paeonian or their East Balkan options:
Paeonian (750–100 BC)40.6%
Thracian (1100–200 BC)25.8%
Balto-Slavic (900–350 BC)21.6%
Anatolian (780–30 BC)9.2%
Phoenician (1000–330 BC)1.8%
Sarmatian (530–250 BC)1.0%
Which of course is unrealistic since it only includes East Balkan but still realistic as it gives less Anatolian. When Both East Balkan and West Balkan are added together I got mostly Illyrian/Paeonian + Thracian and much less Anatolian which
seems the most realistic.
Last edited by Tenn; 06-24-2023 at 04:38 AM.
| Thumbs Up/Down |
| Received: 26/0 Given: 7/0 |
| Thumbs Up/Down |
| Received: 26/0 Given: 7/0 |
I am waiting for my mixed mode breakdown
| Thumbs Up/Down |
| Received: 26/0 Given: 7/0 |
Closest modern populations:
#
POPULATION
DISTANCE
1 North Macedonian 1.775
2 Greek (East Macedonia and Thrace) 1.883
3 Greek (Central Macedonia) 1.928
4 Albanian 1.954
5 Italian (Piedmont) 2.085
6 Swiss (Italian) 2.123
7 Italian (Veneto) 2.162
8 Greek (Thessaly) 2.174
9 Italian (Friuli Venezia Giulia) 2.282
10 Italian (Tuscany) 2.506
11 Italian (Trentino-Alto Adige) 2.657
12 Gagauz 2.679
13 Balkan Turk (North Macedonia) 2.682
14 Italian (Liguria) 2.906
15 Bulgarian 2.927
16 Greek (Central Greece) 2.955
17 Greek (Peloponnese) 2.976
18 Italian (Lombardy) 3.034
19 Italian (Marche) 3.119
20 Italian (Umbria) 3.286
21 Corsican 3.349
22 Romanian 3.533
23 French Occitan (Provence) 3.718
24 Italian (Lazio) 3.766
25 Montenegrin 3.970
26 Italian (Molise) 3.970
27 Balkan Turk (Thessaly) 3.974
28 Italian (Aosta Valley) 4.023
29 Italian (Abruzzo) 4.119
30 Catalan (Baleares) 4.196


| Thumbs Up/Down |
| Received: 11/2 Given: 104/2 |
Illustrative DNA was horrible for me too. Made zero sense. I see that it works quite well for Europeans as always, specifically North/west europeans and iberians but....anything else usually isnt too accurate. Doesn't work too well for some mixed people.

| Thumbs Up/Down |
| Received: 2,078/2 Given: 1,768/1 |
You have very nice % of slavic and you hate slavs.... oh life irony

| Thumbs Up/Down |
| Received: 52,620/1,011 Given: 43,526/788 |
Lmao you are less Illyrian than me


| Thumbs Up/Down |
| Received: 19,318/97 Given: 15,037/51 |
For me Illustrative DNA was great, I am very satisfied.Originally Posted by eastern

🔴
🔵
⚪


| Thumbs Up/Down |
| Received: 3,477/5 Given: 1,482/1 |
Nice results
| Thumbs Up/Down |
| Received: 26/0 Given: 7/0 |
Turns out you can change the settings on this thing, so with only 3 ancient populations gives me around 60% Illyrian:
There are currently 1 users browsing this thread. (0 members and 1 guests)
 Posting Permissions

 Reply With Quote
Bookmarks