

11


| Thumbs Up |
| Received: 7,587 Given: 6,008 |
Sample size is 980 and it should be more representative than other things we saw in the past. It was collected by former TA user Dunai, so this is entirely his effort.
1. R-M420 (R1a): 28%
2. R-M343 (R1b): 18.5%
3. I-M438 (I2): 17%
4. E-M215 (E1b1b): 9%
5. I-M253 (I1): 7.5%
6. J-M172 (J2): 7.5%
7. G-M201: 4.5%
8. N-M231: 3.5%
9. Q-M242: 1.5%
10. J-M267 (J1): 0.5%
11. T-L206: 0.5%
12. L-M20: 0.5%
13. C-F3393 (C1): 0.5%


| Thumbs Up |
| Received: 4,021 Given: 1,375 |
Thanks for the statistics


| Thumbs Up |
| Received: 3,401 Given: 3,080 |
Why do you have those dumplings in your avatar?Originally Posted by Katarzyna


| Thumbs Up |
| Received: 453 Given: 559 |
Shhh. Its cute. > : (
| Thumbs Up |
| Received: 453 Given: 559 |
50% R and no O… Odd.
Last edited by Abti; 12-19-2023 at 05:12 PM.
| Thumbs Up |
| Received: 7,587 Given: 6,008 |
Trying to troll?")


| Thumbs Up |
| Received: 250 Given: 32 |
Another good exemple on the joke called ethno-nationalism. Over 10 haplogroups, which is no different than Brazil or Canada, no common ancestor and subsequent common genes yet you’ll find ultra-nationalists very easily.
| Thumbs Up |
| Received: 7,587 Given: 6,008 |
You're getting repetitive.
| Thumbs Up |
| Received: 250 Given: 32 |
I don’t care what you think. Stating facts will never get repetitive, should I lie to please you? Typical women reaction, I want to argue with men not you.


| Thumbs Up |
| Received: 11,711 Given: 14,688 |
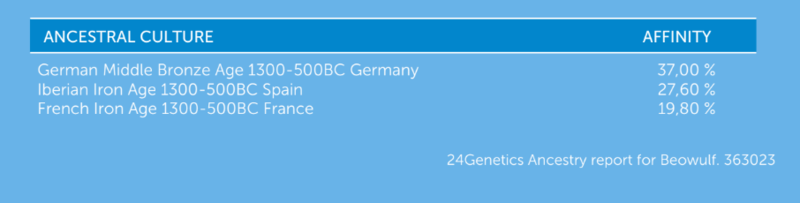
That user did a good work!
24genetics historical results:
Spoiler!
There are currently 1 users browsing this thread. (0 members and 1 guests)
 Северна Македонија
 United States
 Posting Permissions

 Reply With Quote


Bookmarks