

2


| Thumbs Up/Down |
| Received: 781/0 Given: 221/1 |
Is DNAgenics the only place I can get them? Are there other free/paid alternatives?
Y-DNA: I-Y3548 *updated*
mtDNA: H2a2a1


| Thumbs Up/Down |
| Received: 19,322/11 Given: 24,879/5 |
Install this extension https://chromewebstore.google.com/de...pmmlnlah?pli=1
go to gedmatch then eurogenes but choosing the showing chromosome option, go to K36 and use the extension to copy all the k36 coordinates of your chromosomes,
then go to this place https://allelocator.ovh/simulatedg25.html and paste all your k36 chromosomes coordinates and convert them to G25 (simulated).


| Thumbs Up/Down |
| Received: 5,592/4 Given: 6,412/2 |
Just copy (CNTRL-A) your Gedmatch chromosome page results for any calc that the Allelocator site converts for you and paste them here for a direct placement into horizontal form:
data:text/html;base64,PHRleHRhcmVhPjwvdGV4dGFyZWE+CjxzY3JpcH Q+ZG9jdW1lbnQucXVlcnlTZWxlY3RvcigidGV4dGFyZWEiKS5v bmlucHV0PWZ1bmN0aW9uKCl7Y29uc3QgdD1bLi4udGhpcy52YW x1ZS5tYXRjaCgvKD88PVxzKVwtfFtcZFwuXSsoPz0lXHMpL2dt KV0ubWFwKE51bWJlcikubWFwKCh0PT5pc05hTih0KT8wOnQpKS 5yZWR1Y2UoKCh0LGEsZSk9Pntjb25zdCBuPU1hdGguZmxvb3Io ZS8yMik7cmV0dXJuIHRbbl18fD1bXSx0W25dLnB1c2goYSksdH 0pLFtdKTt0aGlzLnZhbHVlPXRbMF0ubWFwKCgoYSxlKT0+dC5t YXAoKHQ9PnRbZV0pKSkpLm1hcCgoKHQsYSk9PmBjaHIke2ErMX 0sJHt0LmpvaW4oIiwiKX1gKSkuam9pbigiXG4iKX08L3Njcmlw dD4=
Then put all 22 chromosomes in that format into the Allelocator tool Beowulf mentioned above and click the appropriate button for the calc results you chose and you have them.
Target: SC_NewDeepModernScaled_Official_Merged
Distance: 1.7028% / 0.01702792 | ADC: 2x RC
57.2 Irish
42.8 Norwegian
| Thumbs Up/Down |
| Received: 781/0 Given: 221/1 |
Would you say k36 is better for chromosomal coordinates than k13?Originally Posted by Beowulf

Y-DNA: I-Y3548 *updated*
mtDNA: H2a2a1
| Thumbs Up/Down |
| Received: 5,592/4 Given: 6,412/2 |
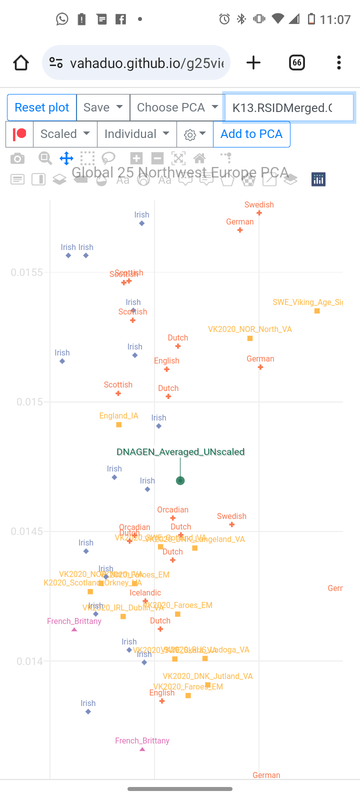
Possibly neither will be "best" or most accurate. Plot your K13, K15, and K36 against your official coordinates as one way of seeing their variations. Some will pull to the east and north for me, some to the south and west. My best single plot (not 22-chr) would incorporate my merged data (over 1.15 million SNP), so I plot my merged Ancestry+23andMe results for K13, K15, and K36 against both IllustrativeDNA "official" Ancestry-only coords, then plot in the DNAGenics Ancestry, 23andME, and the AVERAGED G25. The averaged G25 looks most reasonable and closest to official, so I trust those 22-chromosome plots more than I do the Eurogenes of K13, K15, or K36.
Ancestry-only data plots me slightly more southern than 23andMe, so averaging them makes most sense. The average finds the middle point, which is roughly .0025(0.25%) off the "official" Ancestry-only.
Not everyone seems to get accurate DNAGenics coordinates, but mine plot basically on top of my IllustrativeDNA plot, so I trust they are more accurate than any individual K13, K15, or K36 resultant plots with 22-chromosomes. That said, the K36 single plot is closest to my best Averaged plot, so if I had to pick one for me as a single set of coords out of those 3, I would go with K36. The K13 22-chr plot looks better to me though than the K36 in relationship to what I consider my best set of 22-chromosomes. I can attach a pic to show how they individual plots relate and are shifted from each other. Give me a moment.
Target: SC_NewDeepModernScaled_Official_Merged
Distance: 1.7028% / 0.01702792 | ADC: 2x RC
57.2 Irish
42.8 Norwegian
| Thumbs Up/Down |
| Received: 5,592/4 Given: 6,412/2 |
I'm just showing you the Northwest how these things plot to each other and then I select my best individual plot to show you so I would choose those 22 coordinates as my best coordinates which would be my average unscaled g25 coordinates from DNA Gen X because I imagine if I get the illustrative DNA done for coordinates for my 23andMe it would average closest to that spot you can see that it would be somewhere between the 23andMe data and the official ancestry data roughly in the middle
Target: SC_NewDeepModernScaled_Official_Merged
Distance: 1.7028% / 0.01702792 | ADC: 2x RC
57.2 Irish
42.8 Norwegian
| Thumbs Up/Down |
| Received: 781/0 Given: 221/1 |
While I wait for you to attach it, would you say k13, k15 or k36 (or whatever you use) should be used only against the corresponding source (k13 averages, k36 averages etc.)? Also, I noticed some people on the forum post "mixed mode" from vahaduo (or idk if it is vahaduo) - how can I do that, too?
P.S. It just loaded for me, so I see your photo now.
Y-DNA: I-Y3548 *updated*
mtDNA: H2a2a1
| Thumbs Up/Down |
| Received: 5,592/4 Given: 6,412/2 |
This is how the calculator puts the distances to what I consider my best single coordinates:
Distance to: 2datasetsaveragedG25.Brad
0.00690033 1stHalfAveraged.Chr1-8
0.00876122 Brad_23andMe_scaled
0.00886443 Brad_AncestryDNA_Scaled_Official
0.02342994 K36.RSIDMerged.Gedmatch.Brad
0.02399440 K13.RSIDMerged.Gedmatch.Brad
0.02546292 K15.RSIDMerged.Gedmatch.Brad
0.02570080 2ndHalfAveraged.Chr9-22
I think for the mixed mode you can either use the two-way option on explore your dna.com or you can use the oracle web page it's the alternative Vahaduo which most of us use. Just ask one of the guys for that link whoever posted those results. @Dusan ?
I think it's from this web page but I'm not 100% sure:
https://promotopic.com/calculator/vahd.html
Last edited by ScandinavianCelt; 05-04-2024 at 04:38 PM.
Target: SC_NewDeepModernScaled_Official_Merged
Distance: 1.7028% / 0.01702792 | ADC: 2x RC
57.2 Irish
42.8 Norwegian
| Thumbs Up/Down |
| Received: 5,592/4 Given: 6,412/2 |
Check your own plots but since these seem to be my best plot I ran the calculator against what could be my best plot and using the modern unscaled official sample set I get this closest to me at 2X:
Target: DNAGEN_Averaged_UNscaled
Distance: 0.5448% / 0.00544767 | ADC: 2x RC
46.0 Dutch
22.6 Icelandic
21.0 English
10.4 Danish
Target: SC_NewDeepModernScaled_Official_Merged
Distance: 1.7028% / 0.01702792 | ADC: 2x RC
57.2 Irish
42.8 Norwegian
| Thumbs Up/Down |
| Received: 781/0 Given: 221/1 |
Here is how my different coordinates plot against each other. Where can I accumulate an average of them all? The tool on exploreyourdna for merging coordinates isn't working...
Y-DNA: I-Y3548 *updated*
mtDNA: H2a2a1
There are currently 1 users browsing this thread. (0 members and 1 guests)
 Posting Permissions

 Reply With Quote
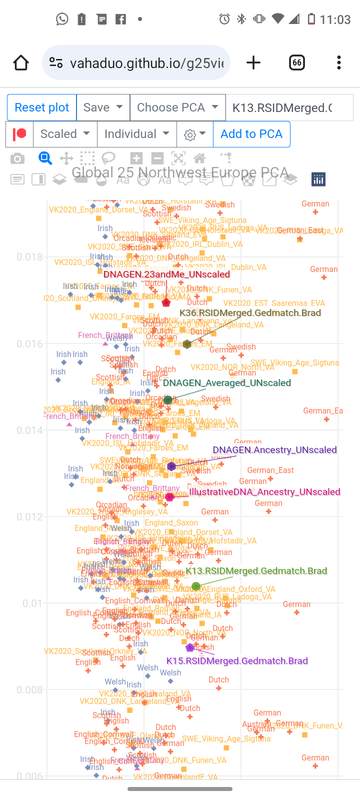
Bookmarks