

0


| Thumbs Up/Down |
| Received: 18/7 Given: 0/0 |
Dodecad v 2.1 shows me as 15.36% Eastern European, which is rather low in comparison. It also has no Finnish cluster and Finland isn't considered to belong to Eastern Europe.
I made an experiment by merging the Dodecad v 2.1 results with those of the euro7 calculator of Dodecad, by adjusting the West_European and East_European elements based on the proportions of Northwestern and Northeastern in euro7.
In consequence, the Dodecad and Eurogenes results have become standardized and almost identical.
Eurogenes vs. Dodecad:

Y-DNA: R1b1b2a1a
mtDNA: T1a1
Eurogenes Biogeographic Ancestry Project: DE29


| Thumbs Up/Down |
| Received: 295/1 Given: 132/0 |
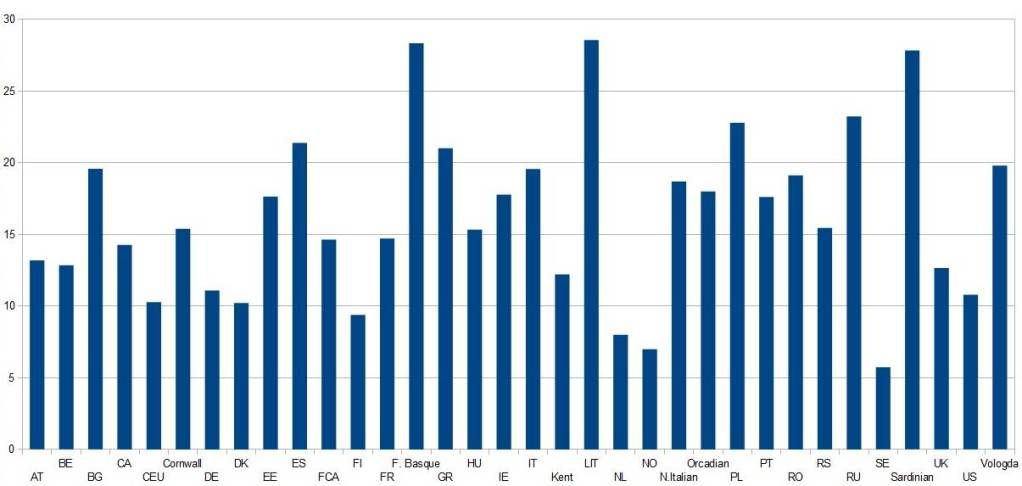
I made a spreadsheet that works as a RMSD calculator for the European members of the NEU.12 run. It is the same as the others I have made. Use OpenOffice, plug your values in and get a chart at the bottom. Here is a link to the spreadsheet, and below is my chart.
Here are my 5 most similar populations in this run:
NO: 3.12
SE: 3.71
NL: 4.44
DK: 5.88
CEU: 6.28
I ran a few tests to check the accuracy of the calculator, and things look fine, but let me know if you experience any problems.
| Thumbs Up/Down |
| Received: 137/0 Given: 28/0 |
As requested:Originally Posted by orangepulp


| Thumbs Up/Down |
| Received: 10,707/143 Given: 13,080/596 |
NEU.12.Q
North Sea 65.2%
Mediterranean 16.6%
Northeast Euro 09.6%
Caucasus 05.2%
South Baltic 01.7%
Sub-Saharan 00.7%
East Asian 00.3%
South Asian 00.2%
Middle Eastern 00.1%
Amerindian 00.00%
Siberian 00.00%
Western Euro 00.0%

| Thumbs Up/Down |
| Received: 758/91 Given: 660/36 |
My Caucasus component always seems to be the higher than the average even higher than Assyrians and equal with Armenians. I am positive my maternal side (North Eastern Turks) would score around 60-70% Caucasus.This may indicate Caucasus ancestry.
Balkan Anatolian Turkic calculator:
11.04% Balkans
83.23% Anatolia
5.73% Turkic
| Thumbs Up/Down |
| Received: 137/0 Given: 28/0 |
What is your "Caucasus" component in Dodecad K12b? Assyrians are around ~50%.
But, yeah, NE Turks are very near the area where the various "Caucasus" like components appear to be modal today.
| Thumbs Up/Down |
| Received: 758/91 Given: 660/36 |
With K12B my Caucasus is same with the Assyrian average, it's 51.2%.
Look at what I got from Larry's program:
Turks: 34.73%
Georgians: 27.56%
Assyrian_D: 24.86% <<<<<<
Sardinian: 5.75%
Mongol:3.86%
Makrani:2.99%
Lezgins: 0.25%
With other runs from Polako and Dienekes my Caucasus was also higher than the average when I was comparing with Turks and with some Assyrians (not average). I noticed that my results overall were closer to Armenians except that I had Turkic input.
Balkan Anatolian Turkic calculator:
11.04% Balkans
83.23% Anatolia
5.73% Turkic


| Thumbs Up/Down |
| Received: 14,296/151 Given: 3,333/0 |
My chart using Rochefaton's spreadsheet:

Click for peruvian rage:
Spoiler!
| Thumbs Up/Down |
| Received: 295/1 Given: 132/0 |
Barreldriver, here is your chart:
Your closest 5 groups are:
BE 2.00
Kent 2.66
US 3.37
UK 3.52
CA 3.68
| Thumbs Up/Down |
| Received: 10,707/143 Given: 13,080/596 |
Hi everyone. I recognize a few of you from another forum (ABF)
Here is my Gedmatch Eurogenes K12b Pie Chart
Hi Rochefaton
Thank you for doing a chart for me on ABF. I'll post it here:
"Closest 5:
SE 5.73
NO 6.99
NL 7.99
FI 9.38
DK 10.21"
There are currently 7 users browsing this thread. (0 members and 7 guests)
 Posting Permissions

 Reply With Quote


Bookmarks