

1


| Thumbs Up/Down |
| Received: 23,702/743 Given: 20,552/1,184 |
I added Native American compatibility to the datasheet.
My DNA Origin analysis for 16 EUR (you get 2 reports examining ancestry from 3012 regions, 226 countries): https://www.exploreyourdna.com/DNAOrigin.aspx
This analysis is not based on G25 but on ADMIXTURE. And it has more regions than any other DNA test!


| Thumbs Up/Down |
| Received: 264/3 Given: 562/210 |
Target: bc76
Distance: 324.0597% / 3.24059685
80.4 Utah_White_with_CEU_1KGP(n=90)
12.0 Minnesota_White(n=27)
6.6 North_Dakota_White(n=10)
1.0 Wisconsin_White(n=65)
Distance to: bc76
3.84007812 Oregon_White(n=18)
3.99097732 Utah_White_with_CEU_1KGP(n=90)
4.29595158 Mississippi_White(n=54)
4.35369958 Alabama_White(n=73)
4.36567291 Georgia_White(n=96)
4.36986270 Utah_White(n=29)
4.42818247 North_Carolina_White(n=102)
4.55733475 Arkansas_White(n=40)
4.65030107 New_Hampshire_White(n=14)
4.74298429 Kentucky_White(n=130)
4.76288778 Idaho_White(n=12)
4.82008299 Indiana_White(n=57)
4.85004124 South_Carolina_White(n=52)
4.85056698 Tennessee_White(n=95)
4.97099588 Maine_White(n=30)
5.02595265 Virginia_White(n=87)
5.04227131 Texas_White(n=97)
5.06174871 Iowa_White(n=34)
5.13027290 Oklahoma_White(n=27)
5.19640260 Colorado_White(n=5)
5.21094041 West_Virginia_White(n=43)
5.45270575 Missouri_White(n=59)
5.62138773 Delaware_White(n=9)
5.73600907 Arizona_White(n=5)
5.80292168 Wyoming_White(n=5)
5.80324047 Nebraska_White(n=24)
5.81477429 Kansas_White(n=20)
6.37687227 Florida_White(n=28)
6.40682449 Washington_White(n=25)
6.71842988 Ohio_White(n=100)
6.92883107 South_Dakota_White(n=6)
6.94771905 Vermont_White(n=5)
7.23435553 California_White(n=60)
7.37229272 Maryland_White(n=37)
7.38918805 Montana_White(n=5)
8.20413310 Minnesota_White(n=27)
8.24361571 Illinois_White(n=107)
8.29684277 Rhode_Island_White(n=14)
8.43828182 Pennsylvania_White(n=179)
8.53986534 Massachusetts_White(n=82)
9.84796933 Wisconsin_White(n=65)
10.34515829 Louisiana_White(n=97)
10.43009108 Michigan_White(n=72)
12.25413808 Connecticut_White(n=29)
12.63513356 New_York_White(n=175)
14.34930312 New_Jersey_White(n=30)
15.07986074 North_Dakota_White(n=10)
16.90182239 New_Mexico_White(n=2)
75.81562306 Inuit(n=6)
78.31547165 Ottawa(n=2)
79.39689855 Chippewa(n=4)
82.09220060 Ojibwe(n=2)
82.82218724 Cree(n=2)
82.83613523 Chipewyan(n=9)
82.97931549 Yellowknives(n=2)
83.80909139 Gwitchin(n=1)
84.32665059 Saulteaux(n=1)
84.56514116 Ponca(n=1)
84.95365030 Shawnee(n=1)
87.20753637 Tulalip(n=1)
87.96461789 Creek(n=2)
88.17415494 Sioux(n=21)
88.24065390 Anishinaabe(n=2)
88.77144811 MHA_Nation(n=6)
89.30573554 Aleut(n=3)
89.43195178 Dene(n=10)
89.70397929 Inupiat(n=4)
89.73094338 Assiniboine(n=1)
90.67463758 Paiute_Shoshone(n=1)
90.98314294 Navajo(n=17)
91.82406221 Hopi(n=6)
91.90448574 Crow(n=1)
93.71841068 Choctaw(n=9)
| Thumbs Up/Down |
| Received: 23,702/743 Given: 20,552/1,184 |
All the ones with Slavic admixture on top!Originally Posted by rothaer

I wonder how much of it is from Slavic immigration, and how much from East German immigration?
Last edited by Peterski; 03-08-2026 at 06:08 PM.
My DNA Origin analysis for 16 EUR (you get 2 reports examining ancestry from 3012 regions, 226 countries): https://www.exploreyourdna.com/DNAOrigin.aspx
This analysis is not based on G25 but on ADMIXTURE. And it has more regions than any other DNA test!


| Thumbs Up/Down |
| Received: 1,658/15 Given: 3,304/5 |
From ChatGPT:
1. The Core Genetic Profile of the Southern / Appalachian States
Look at states that were closest to you:
Virginia
Kentucky
Tennessee
West Virginia
South Carolina
Missouri
Now look at their closest European groups:
State - Closest ancestry
Virginia - Southwest English
Kentucky - Southwest English
Tennessee - Southwest English
West Virginia - Southwest English
South Carolina - Southwest English
Missouri - Southwest English
Second place in almost every one:
Southeast English
Third:
Irish
West Scottish
This is extremely consistent.
What that means
These states genetically resemble populations from:
Southwest England
Southeast England
with smaller Irish / Scottish influence
That combination is exactly the colonial English + Ulster Scots mix that populated the American frontier.
2. Why Southwest English Shows Up So Strongly
Many Americans assume Appalachian ancestry = Scottish.
But genetically the biggest contributor was actually:
Southwest England
Especially from:
Devon
Cornwall
Somerset
Dorset
These regions supplied huge numbers of early settlers to:
Virginia
Maryland
North Carolina
the Chesapeake
Later their descendants moved inland into:
Kentucky
Tennessee
Missouri
Which is precisely the migration corridor your genealogy follows.
3. The Dutch Signal
Youll notice something interesting in many states:
North_Dutch
South_Dutch
appear frequently in the top 5.
This reflects two historical groups:
1️⃣ New York Dutch colonists
(New Netherland settlers)
2️⃣ German immigrants
who genetically overlap with Dutch populations
This is why Dutch shows up in:
Pennsylvania
Ohio
Midwest states
California
| Thumbs Up/Down |
| Received: 1,658/15 Given: 3,304/5 |
7. The Most Interesting Outlier: Utah
This one stands out:
Utah
1.62 Irish
1.83 Southeast English
2.00 West Scottish
Utah reflects Mormon pioneer ancestry, which came largely from:
• England
• Scotland
• Ireland
So genetically it resembles British Isles populations directly.
| Thumbs Up/Down |
| Received: 23,702/743 Given: 20,552/1,184 |
I made a map of distance to English (for Utah I used the average without CEU 1KGP samples):
https://i.postimg.cc/2CpgDLNg/Distance-to-English.png
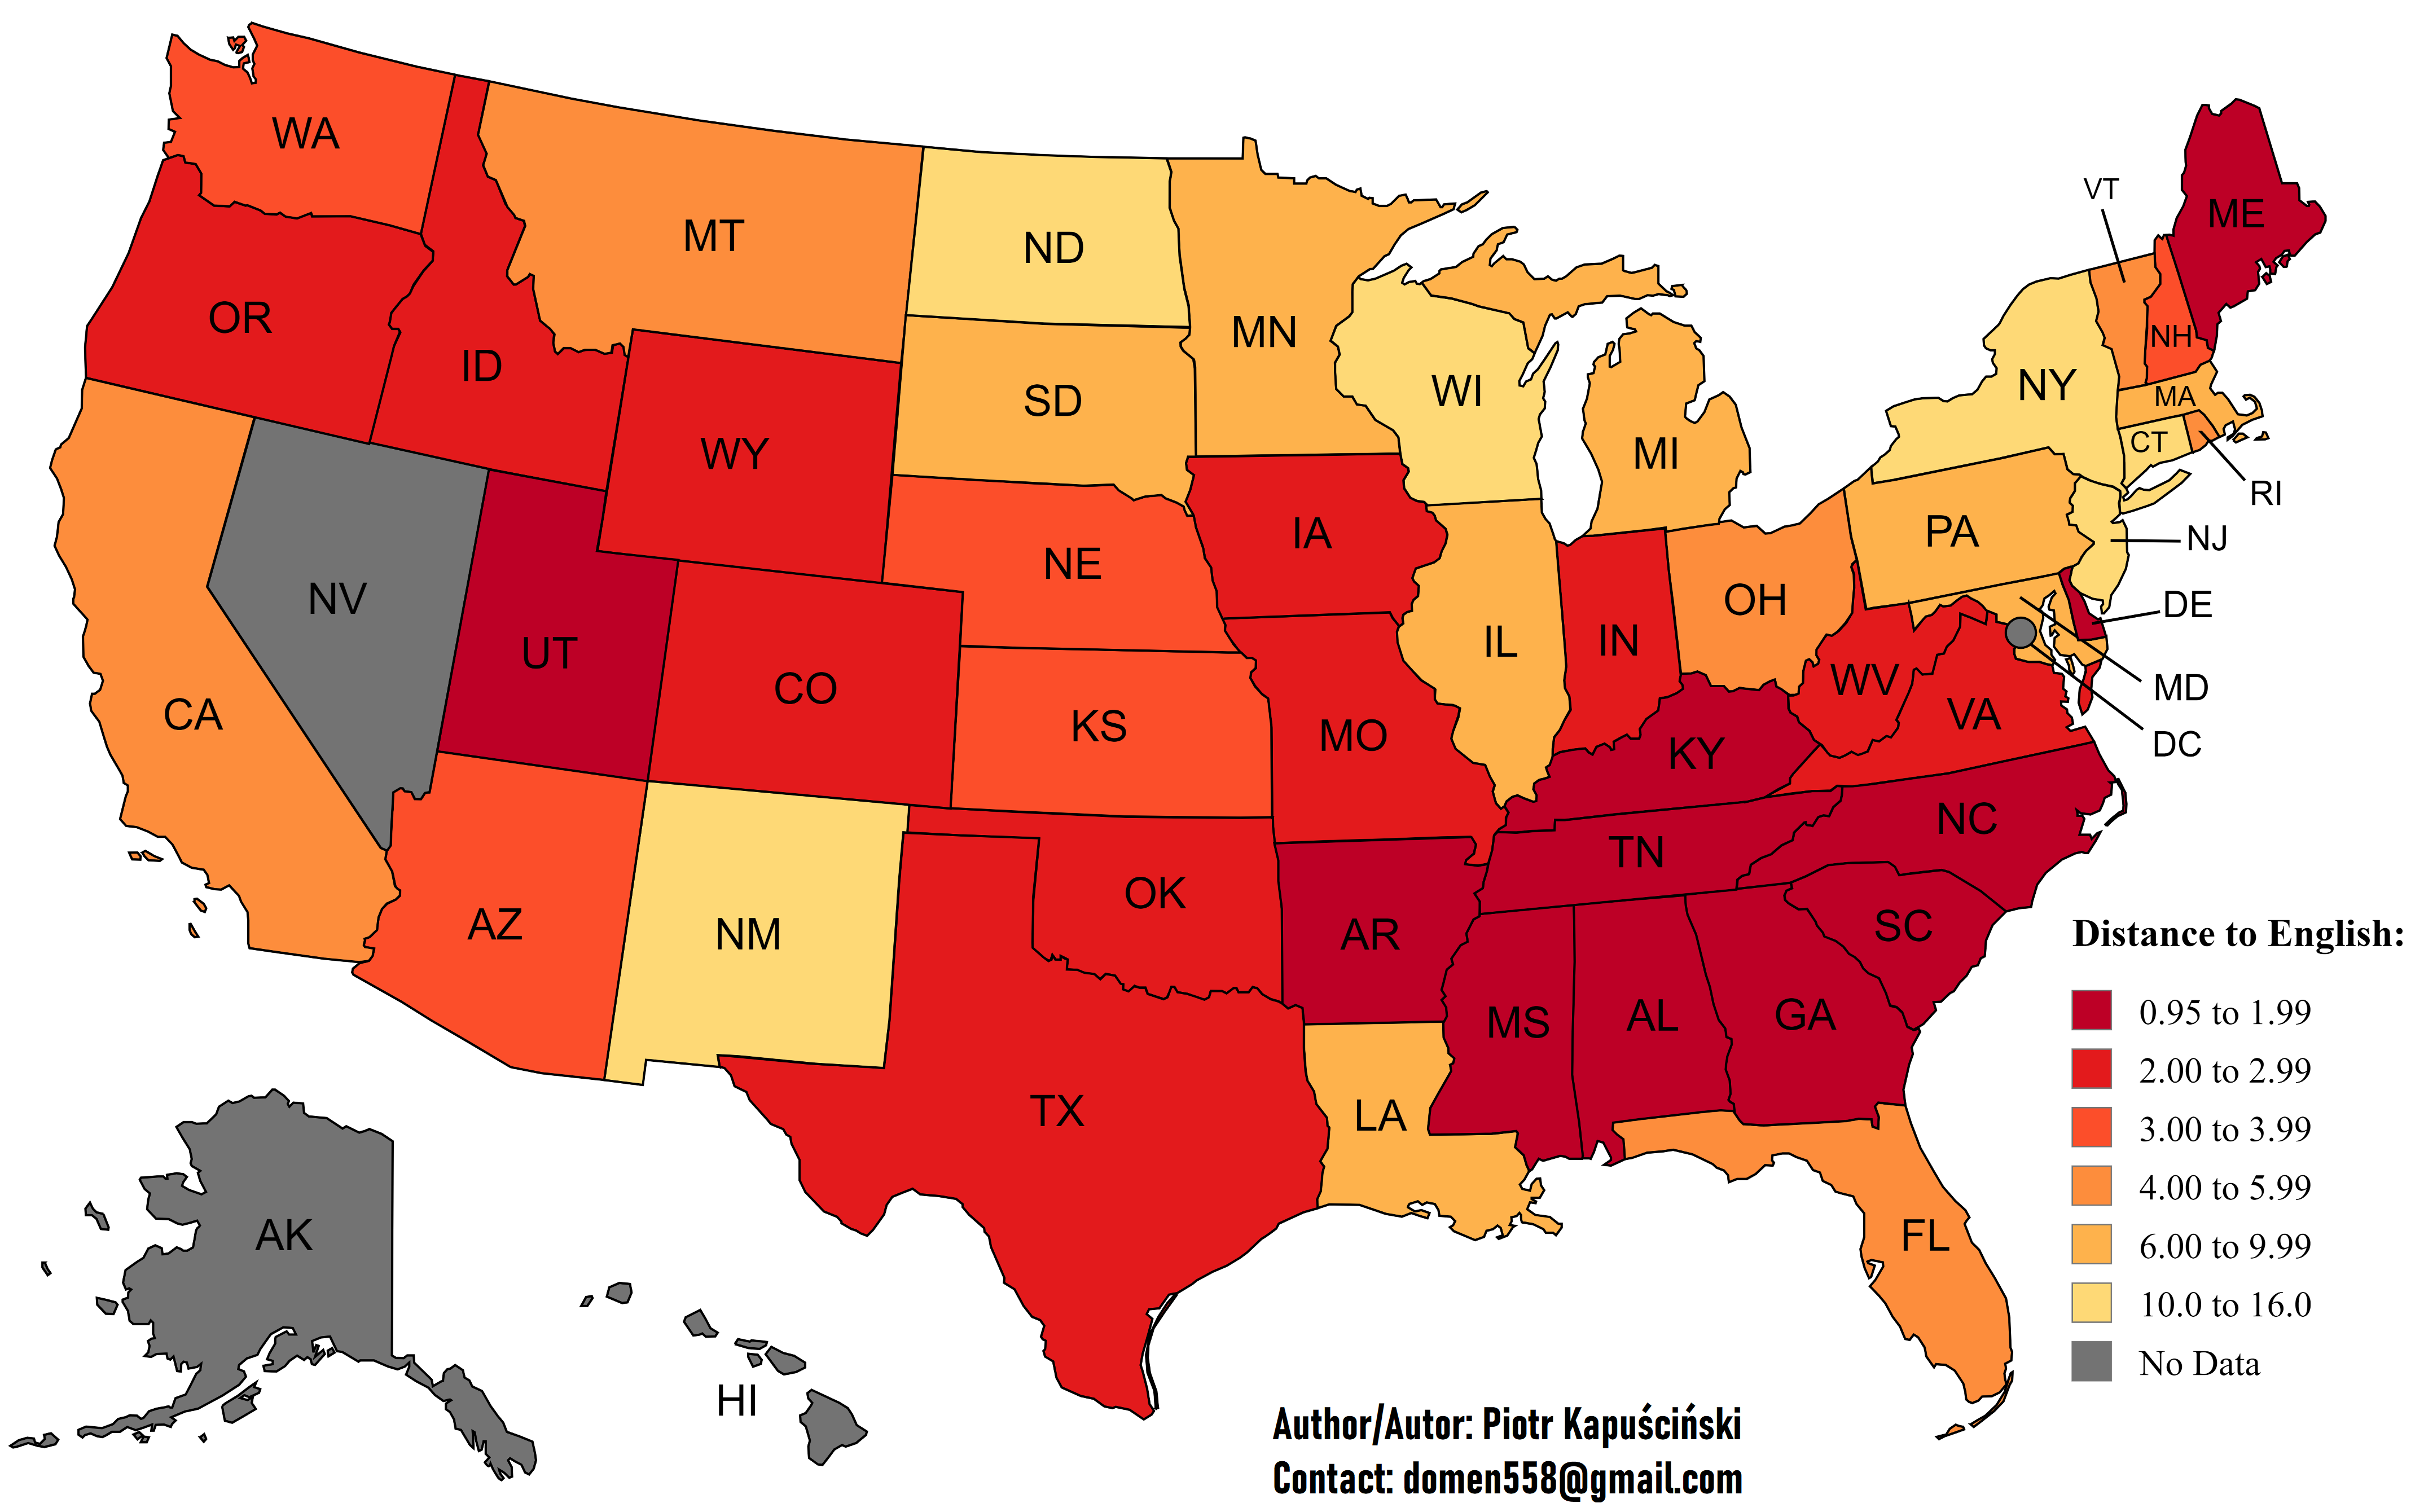
Last edited by Peterski; 03-08-2026 at 08:48 PM.
My DNA Origin analysis for 16 EUR (you get 2 reports examining ancestry from 3012 regions, 226 countries): https://www.exploreyourdna.com/DNAOrigin.aspx
This analysis is not based on G25 but on ADMIXTURE. And it has more regions than any other DNA test!
| Thumbs Up/Down |
| Received: 23,702/743 Given: 20,552/1,184 |
^^^
For comparison self-reported English ancestry in the 1980 census:

My DNA Origin analysis for 16 EUR (you get 2 reports examining ancestry from 3012 regions, 226 countries): https://www.exploreyourdna.com/DNAOrigin.aspx
This analysis is not based on G25 but on ADMIXTURE. And it has more regions than any other DNA test!


| Thumbs Up/Down |
| Received: 17,437/194 Given: 8,238/117 |
IMHO it's because Southerners are more German/French/other mixed, and less Irish/Scottish than they proclaim. Utah is also heavily Northern/North Midlands English (plus some Welsh), who have more Insular Celtic blood than the Southern English ancestry that dominates elsewhere in the US.
Spoiler!

| Thumbs Up/Down |
| Received: 154/9 Given: 57/0 |
Target: codex_scaled
Distance: 3.2757% / 0.03275713
48.8 Utah(n=52)
27.8 Georgia(n=50)
22.6 South_Dakota(n=7)
0.8 Arizona(n=5)
Distance to: codex_scaled
0.03416089 Oklahoma(n=27)
0.03444408 Utah(n=52)
0.03478651 Kentucky(n=65)
0.03492214 Georgia(n=50)
0.03508152 South_Carolina(n=52)
0.03519125 Virginia(n=87)
0.03531910 Tennessee(n=47)
0.03532430 Delaware(n=9)
0.03542806 Alabama(n=73)
0.03556299 Colorado(n=5)
0.03558140 North_Carolina(n=74)
0.03559838 Idaho(n=12)
0.03561059 Iowa(n=34)
0.03565765 Arizona(n=5)
0.03579606 West_Wirginia(n=43)
0.03591617 Mississippi(n=22)
0.03598216 Arkansas(n=39)
0.03633632 Washington(n=25)
0.03640180 Missouri(n=25)
0.03641218 Oregon(n=18)
0.03651365 Maine(n=30)
0.03681835 Texas(n=37)
0.03686440 Nebraska(n=24)
0.03710877 Kansas(n=20)
0.03714912 Indiana(n=57)
| Thumbs Up/Down |
| Received: 23,702/743 Given: 20,552/1,184 |
^^^
Codex, you are using old averages. Check the latest version (I added more kits to some averages).
My DNA Origin analysis for 16 EUR (you get 2 reports examining ancestry from 3012 regions, 226 countries): https://www.exploreyourdna.com/DNAOrigin.aspx
This analysis is not based on G25 but on ADMIXTURE. And it has more regions than any other DNA test!
There are currently 1 users browsing this thread. (0 members and 1 guests)
 Posting Permissions


Bookmarks