

7


| Thumbs Up/Down |
| Received: 23,702/743 Given: 20,551/1,184 |
I've been making some maps showing the distribution of Native Americans in various countries.
Bolivia:
Peru:
(1940 census and 2017 census)
Guatemala:
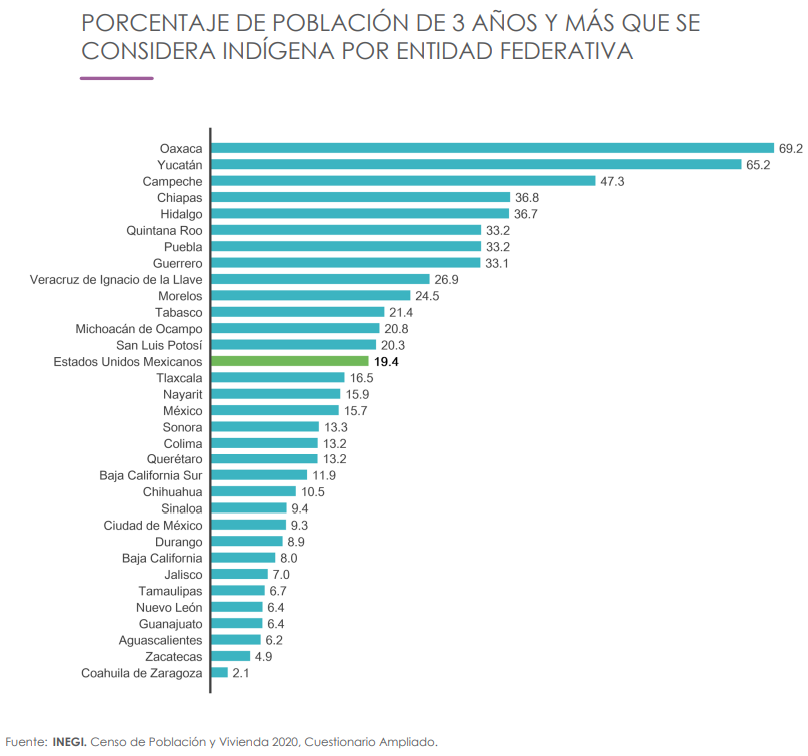
Mexico:
Chile:
(2017 census and 2024 census)
Panama:
Guyana:
Brazil:
More will follow.
My DNA Origin analysis for 16 EUR (you get 2 reports examining ancestry from 3012 regions, 226 countries): https://www.exploreyourdna.com/DNAOrigin.aspx
This analysis is not based on G25 but on ADMIXTURE. And it has more regions than any other DNA test!


| Thumbs Up/Down |
| Received: 8,528/382 Given: 13,782/309 |
I think for Mexican % map it's off for certain regions in Mexico. I don't think Amerindians make up 1% for Northern Mexican states .
Way off for another Mexican state of Jalisco. The map says 7% no way.
Reality is 0.92% Amerindian pop in Jalisco
"Según el censo del INEGI de 2020, hay en el Estado de Jalisco un total de 80 mil 951 personas que se autodescriben como indígenas, y que habitan principalmente en Mezquitic con 15 mil 404 personas, Tuxpan con 4 mil 939 personas y Bolaños con 3 mil 826."
Conforme a las proyecciones de población vigentes, publicadas en agosto de 2023 por el Consejo Nacional de Población (CONAPO), al primero de enero de 2024, hay en Jalisco 8 millones 778 mil 827 habitantes; de los cuales el 50.7% (4 ́447,123) son mujeres y el 49.3% (4 ́331,704) hombres.
The map has Chiapas the most amerindian state of Mexico at 36.8% amerindian pop. It neighbors Guatemala. It's way higher for sure.
| Thumbs Up/Down |
| Received: 23,702/743 Given: 20,551/1,184 |
Yes I was also surprised by these relatively high percentages in northern Mexico.Originally Posted by RMuller

Well the map is based on official census data from the 2020 census, check here:
https://www.inegi.org.mx/contenidos/...60.pdf#page=63
Last edited by Peterski; 03-18-2026 at 01:28 AM.
My DNA Origin analysis for 16 EUR (you get 2 reports examining ancestry from 3012 regions, 226 countries): https://www.exploreyourdna.com/DNAOrigin.aspx
This analysis is not based on G25 but on ADMIXTURE. And it has more regions than any other DNA test!
| Thumbs Up/Down |
| Received: 23,702/743 Given: 20,551/1,184 |
Caribbean islands:
Colombia:

Last edited by Peterski; 03-18-2026 at 11:23 PM.
My DNA Origin analysis for 16 EUR (you get 2 reports examining ancestry from 3012 regions, 226 countries): https://www.exploreyourdna.com/DNAOrigin.aspx
This analysis is not based on G25 but on ADMIXTURE. And it has more regions than any other DNA test!
| Thumbs Up/Down |
| Received: 23,702/743 Given: 20,551/1,184 |
Chiapas was actually less than half Amerindian already in the 1921 census:
https://www.indigenousmexico.org/art...-and-thecensus
My DNA Origin analysis for 16 EUR (you get 2 reports examining ancestry from 3012 regions, 226 countries): https://www.exploreyourdna.com/DNAOrigin.aspx
This analysis is not based on G25 but on ADMIXTURE. And it has more regions than any other DNA test!


| Thumbs Up/Down |
| Received: 47/2 Given: 1/0 |
The 2017 one for Peru is definitely not racial, i haven't read the 1940 census yet though.
Altough not the majority, there are still a sizable chunk/minority of people with a totally indigenous american phenotype in the northern coast, at least in some parts of it. I'd say the only Peruvian region with a kinda low proportion of people with a totally indigenous phenotype is Tumbes because it's a small region and people there are more homogeneous and mostly in the indomestizo-mestizo range.
| Thumbs Up/Down |
| Received: 8,528/382 Given: 13,782/309 |
lol
"Southern Mexico, especially states like Oaxaca and Chiapas, exhibits the highest levels of Indigenous ancestry, often exceeding 80%. This region was less affected by Spanish colonization due to its geography and the persistence of Indigenous governance. Genetic analyses confirm strong continuity between modern Indigenous groups and their ancestors, with minimal European influence. Studies in Genome Biology and Evolution highlight genetic adaptations in some Indigenous populations, such as altitude-related traits shaped by long-term evolutionary pressures."
https://biologyinsights.com/mexican-...stry-insights/
AS i said before Chiapas is the most amerindian state in Mexico. And it has the highest % Amerindian population in Mexico. Chiapas borders Guatemala.
| Thumbs Up/Down |
| Received: 8,528/382 Given: 13,782/309 |
They are not accurate for Northern Mexico and West-central Mexico.


| Thumbs Up/Down |
| Received: 17,164/30 Given: 31,879/52 |
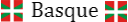
Agentina (Census 2022).
Overall the country: 2.9%
Last edited by Erronkari; 03-20-2026 at 12:40 AM.
| Thumbs Up/Down |
| Received: 23,702/743 Given: 20,551/1,184 |
Suriname:
Belize:
Venezuela:
Uruguay:
Argentina:
Ecuador:
Paraguay:
El Salvador:
Nicaragua:
Honduras:
Costa Rica:
And this is all for Latin America, I finished.
=====
Final map - for both Americas combined:
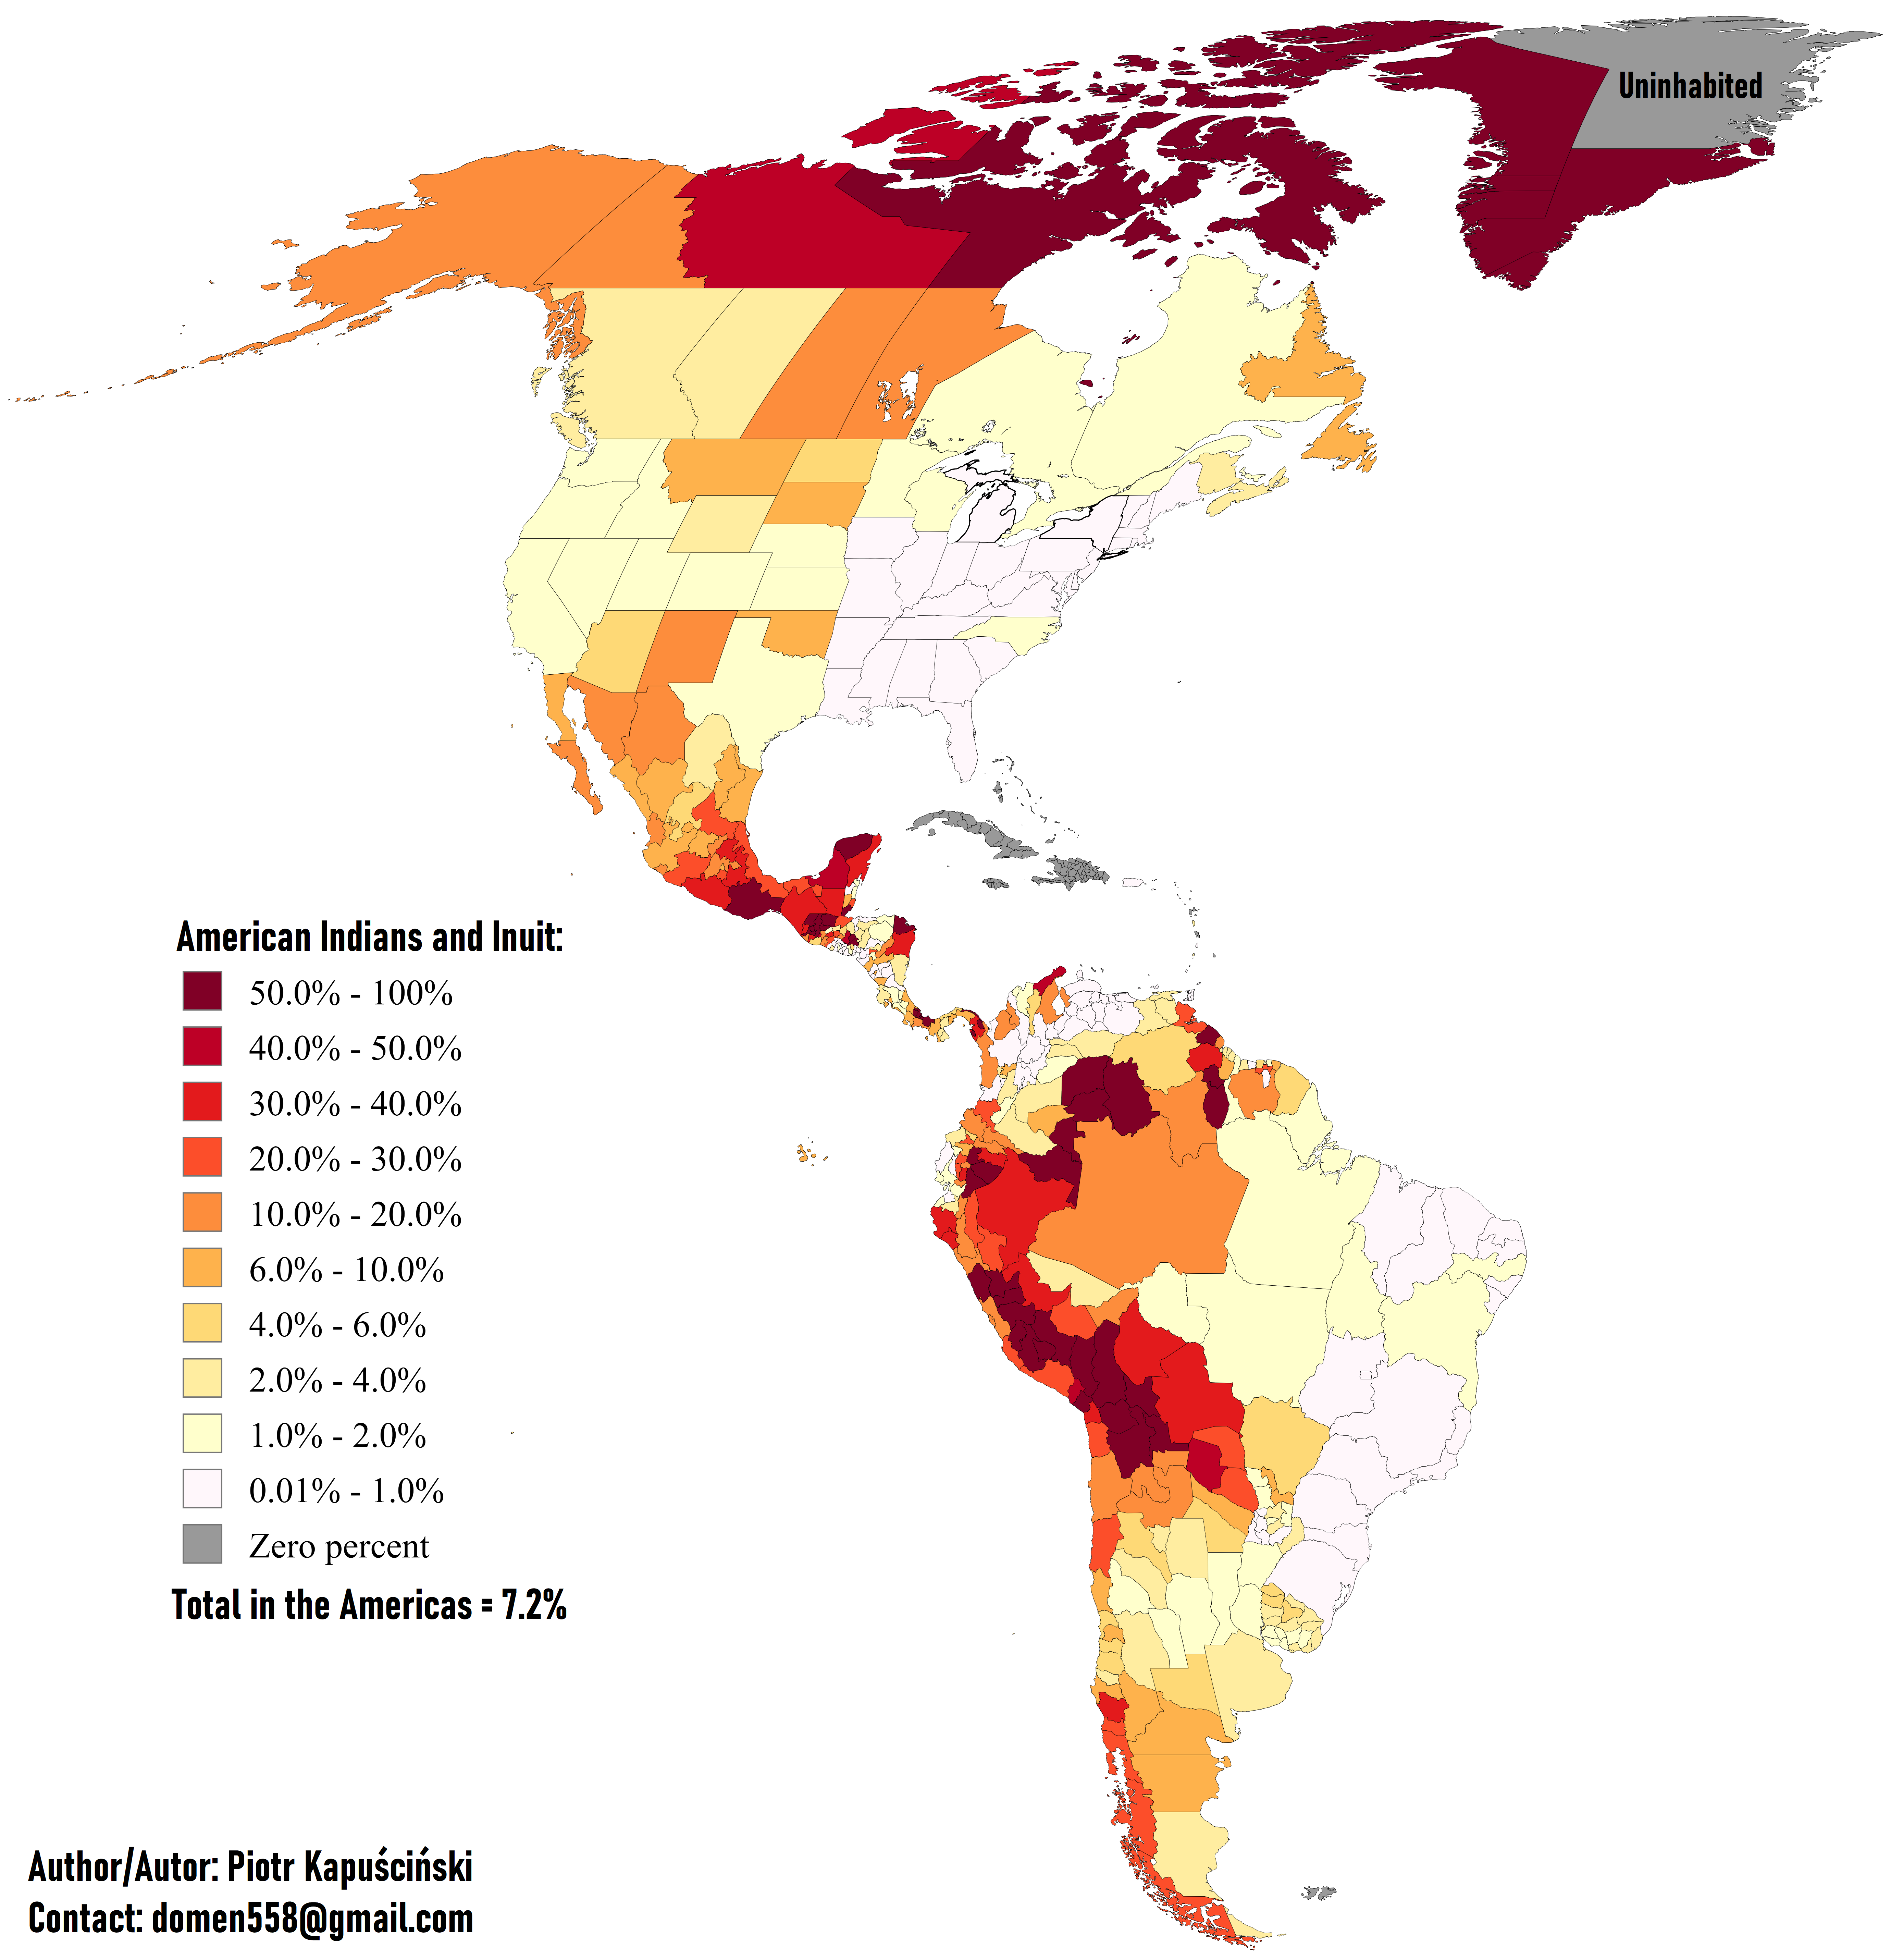
Last edited by Peterski; 03-31-2026 at 10:28 PM.
My DNA Origin analysis for 16 EUR (you get 2 reports examining ancestry from 3012 regions, 226 countries): https://www.exploreyourdna.com/DNAOrigin.aspx
This analysis is not based on G25 but on ADMIXTURE. And it has more regions than any other DNA test!
There are currently 1 users browsing this thread. (0 members and 1 guests)
 Posting Permissions


 Reply With Quote


Bookmarks