

0


| Thumbs Up/Down |
| Received: 40,087/2,222 Given: 10,729/944 |
Agrippa - so which modern group is the best representation of the Neolithic migrants into Europe, genetically? Might it be Armenians and Georgians?

| Thumbs Up/Down |
| Received: 376/7 Given: 0/0 |
These representatives of the "Anatolian signal" were at least important sources for the Neolithic and Metal Age expansions from the Northern part probably and going through the Caucasus into Eastern Europe, over the Anatolia into South Eastern Europe.Originally Posted by cg93

But I think it is possible that there were other Neolithic expansions with different signals.
This is just an important one for the East and most likely present in early Indo-Europeans too.
If that component analysis represents a real, distinguishable element, I would say that Sardinian was part of it too obviously and if talking about the secondary centres, NE European as well.
So there was not just one expansion. But for this signal, this group, which I would also connect to the yDNA E-V13 and J2, "West Asian" might be not the signal 1:1, but seems to be at least related - at least it would fit into the necessary profile.
And today, well, it is simple, you see in which groups it is strongest, where it best survived genetically - not necessary racially, because if going after sites like Çatalhöyük, they were mostly Mediterranoid, whereas todays carriers being often "Armenoidicised".
The populations would be Lezgins and Georgians in particular, Armenian and Assyrian too.


| Thumbs Up/Down |
| Received: 3/0 Given: 0/0 |
My latest results - DOD347
75.07% Northwest European (Average UK - 69.5%, Average Ireland - 74.8%)
8.73% Northeast European (Average UK - 10.1%, Average Ireland - 7.6%)
8.26% Basque (Average UK - 8.4%, Average Ireland - 10.4%)
5.57% Sardinian (Average UK - 9%, Average Ireland - 4.5%)
1.81% West Asian (Average UK - 2.4%, Average Ireland - 2.3%)
0.2% South Asian (Average UK - 0.2%, Average Ireland - 0.3%)
0% South West Asian (Average UK - 0%, Average Ireland - 0.1%)
0% East Asian (Average for both UK and Ireland is 0%)
0% North African (Average for UK - 0.1%, Average for Ireland - 0%)
0% Sub-Saharan (Average for UK - 0.2%, Average for Ireland - 0%)
0% East African (Average for both UK and Ireland is 0%)
I'm below or at average for most of the categories, but my NW Euro is 6% higher, closer to the Irish than the British average).

| Thumbs Up/Down |
| Received: 438/31 Given: 0/0 |
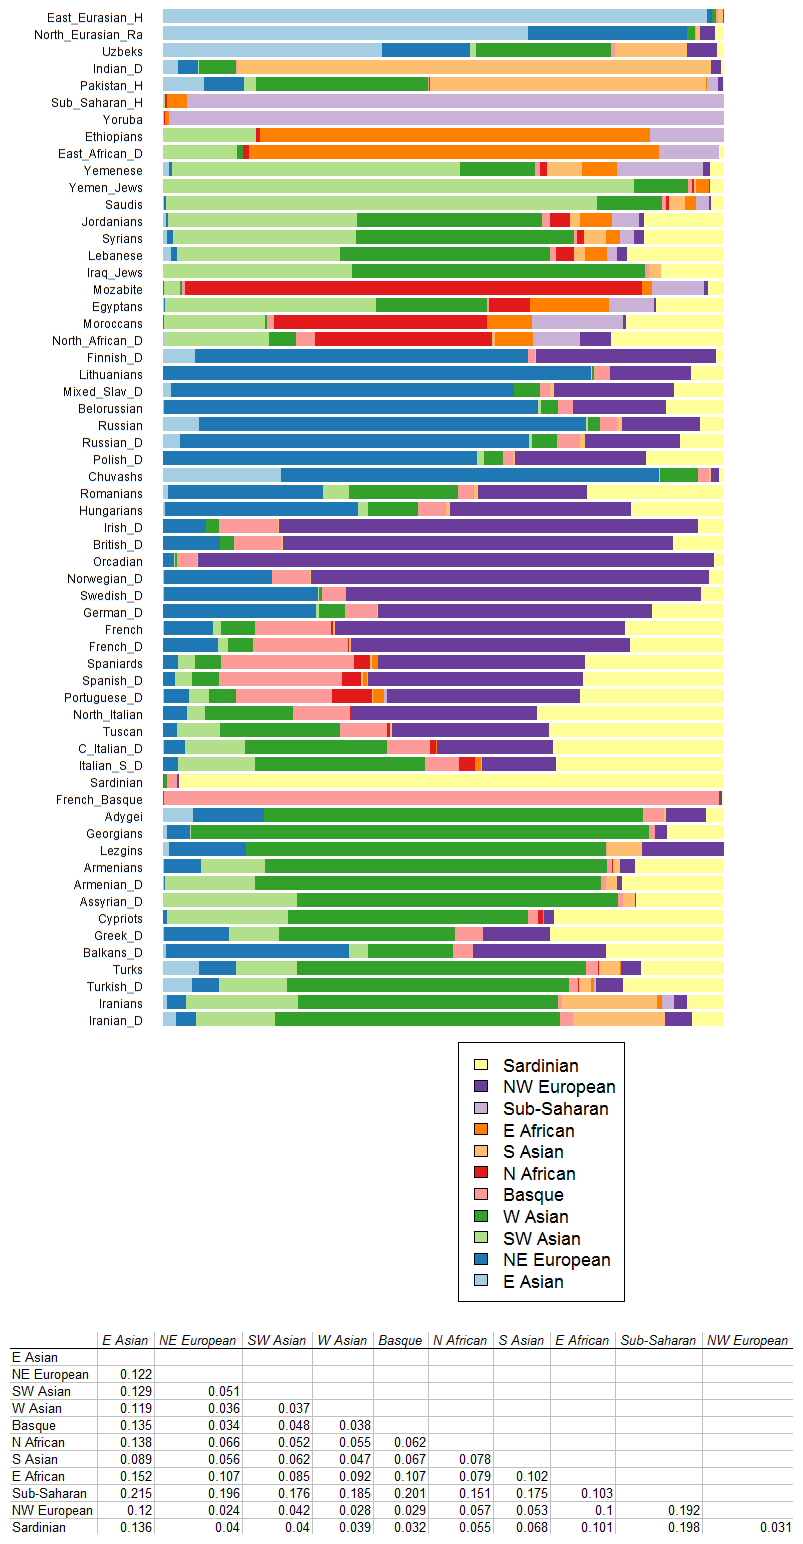
Some gradient maps by Loxias from ABF.
http://www.forumbiodiversity.com/sho...&postcount=459
North-West European:
N-East European:
Basque:
Sardinian:
East Asian:
West Asian:
South-West Asian:
South Asian:
North African:
East African:
Sub-Saharan African:

| Thumbs Up/Down |
| Received: 376/7 Given: 0/0 |
What's also interesting is the relationship of the components to each other, at the bottom of the picture:
Just look at the fact, that North Eastern is closer to Basque than to West Asian, even though they are geographically closer TODAY, while on the other hand, NW European is closer to West Asian than what one might think it would, if looking at the geographical distribution!
West Asian is almost - so practically as - close to North Western as Basque is.
The distance to South Western is MUCH larger in comparison.
Sardinian is closest to North Western!
It looks to me, as if the North Western component could be, actually, more of a mix of other components in this scheme at least, showing so close relationships to the rest.
North Eastern on the other hand is distant from all the other components, but close, really close, only to North Western.
This implies to me that this North Eastern is more of an isolated (Mesolithic? Together with Basque?) component, whereas North Western shows strong connections to all the components common in Europe, almost on the same level.
North Western is the closest match for North Eastern, West Asian, Basque and Sardinian.
So I'd assume the Northern component of the North West is the result of a mixture from all those elements marching North in very ancient times, closest to North Eastern, but also close to the rest of the main European components.
At least if overstretching the data and my imagination
But I found it really interesting how that is possible and expect further break ups, especially with more data...
Last edited by Agrippa; 04-25-2011 at 06:04 PM.
| Thumbs Up/Down |
| Received: 137/0 Given: 28/0 |
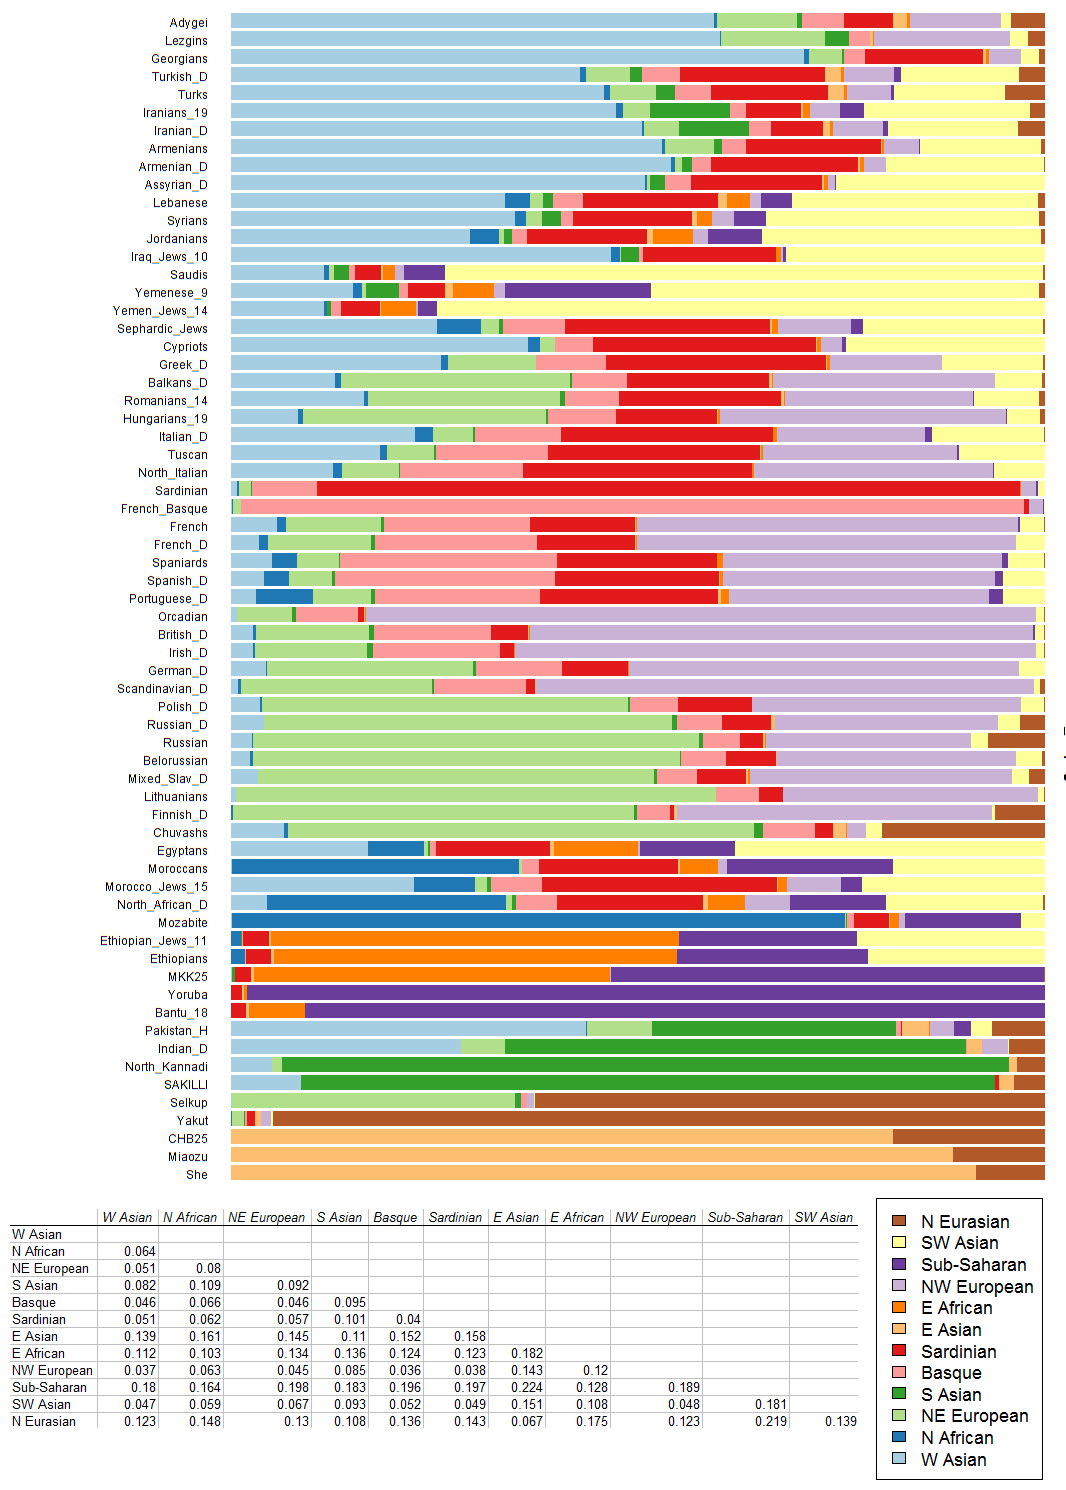
I agree. Originally, I included only the Armenians, Assyrians, and Iraqi [Babylonian] Jews in the graphic I am attaching, below. After reading your comment, I added the Georgian and Lezgin Dodecad K11 averages.


| Thumbs Up/Down |
| Received: 15/6 Given: 0/0 |
How accurate are these results, are they more accurate when you compare to a group with similar ancestry?
| Thumbs Up/Down |
| Received: 438/31 Given: 0/0 |
K=12 ADMIXTURE results for selected participants
DOD197
North-west European 58.68%
North-east European 29.93%
Basque 9.01%
West Asian 1.73%
East Asian 0.47%
Sardinian 0.17%
North African 0%
South Asian 0%
East African 0%
Sub-Saharan 0%
South-west Asian 0%
North Eurasian 0%
| Thumbs Up/Down |
| Received: 438/31 Given: 0/0 |
Some of the K=12 sheets
Scandinavians
(I'm nr.12)
British
Finns
Germans
Irish
Polish
Russians

| Thumbs Up/Down |
| Received: 3/0 Given: 0/0 |
DOD347
63.05% North West European (UK average 61.7%, Ireland average 63.9%) - decrease from last run of 12.02%
16.84% North East European (UK average 13.9%, Ireland average 13.7%) - increase from last run of 8.11%
12.72% Basque (UK average 14.4%, Ireland average 15.6%) - increase from last run of 4.46%
3.85% Sardinian (UK average 4.6%, Ireland average 1.8%) - decrease from last run of 1.72%
1.28% North African (UK average 0.4%, Ireland average 0.2%) - increase from last run of 1.28%
1.24% West Asian (UK average 2.7%, Ireland average 2.8%) - decrease from last run of 0.57%
0.81% East African (UK average 0.2%, Ireland average 0.1%) - increase from last run of 0.81%
0.2% South West Asian (UK average 1.1%, Ireland average 1%) - increase from last run of 0.2%
0% Sub-Saharan (UK average 0.3%, Ireland average 0%) - remained the same
0% South Asian (UK average 0.6%, Ireland average 0.7%) - decrease from last run of 0.2%
0% East Asian (UK average 0.1%, Ireland average 0%) - remained the same
0% North Eurasian (UK average 0.1%, Ireland average 0.1%) - not included in last run
There are currently 7 users browsing this thread. (0 members and 7 guests)
 Posting Permissions

 Reply With Quote


Bookmarks