

0


| Thumbs Up/Down |
| Received: 376/7 Given: 0/0 |
Results are quite different now in many respects, also compare the components to each other.
NW is now even closer to West Asian than before (0,037) and further removed from North Eastern (0,045), North Eastern is now almost as close to Basque as to NW.
That points to what I said before about the components relations, but in this analysis, which seems to be more detailed, it becomes even more clear that North Western has much closer relations to the Neolithic-Southern components than North Eastern.
If comparing with SW Asian, NE Euro is much further away with 0,067 than NW Euro with 0,048 - almost the same distance as between NW and NE with 0,045.
I don't know how this can be (if comparing with the older analysis), but this would really put NE Euro in the category of the older European population elements or an isolated one, while NW is the component of an expansion (Mesolithic, from specific refugia? Neolithic, even Metal Age influences?) much closer related to the Neolithic-Southern components.
Well, let's look for new surprises in new runs
Last edited by Agrippa; 04-29-2011 at 12:18 PM.


| Thumbs Up/Down |
| Received: 19,762/81 Given: 5,912/35 |
DOD345
NW European 67.37%
Basque 19.14%
NE European 10.57%
SW Asian 1.48%
West Asian 1.11%
South Asian 0.22%
Sub Saharan 0.11%
All the rest on 0%
| Thumbs Up/Down |
| Received: 376/7 Given: 0/0 |
I also noticed that many Dodecad Indians, Iranians and Pakistani (mostly Northern and higher caste) have NE, NW and WA in the mix, with NW being particularly interesting.
Actually even Jordanians and Lebanese show the NW now, but Iraqi Jews only one.
Morocco Jews too though.
Some Mozabites too, as well as most North Africans, Syrians and some Saudis.
So NW is now really defined differently obviously...
And South West Asian is now practically everywhere.

| Thumbs Up/Down |
| Received: 438/31 Given: 0/0 |
My results in comparison with two other Norwegians
DOD197(me)
North-west European 58.68%
North-east European 29.93%
Basque 9.01%
West Asian 1.73%
East Asian 0.47%
Sardinian 0.17%
North African 0%
South Asian 0%
East African 0%
Sub-Saharan 0%
South-west Asian 0%
North Eurasian 0%
DOD306(West Norwegian)
North-west European 61.54%
North-east European 22.38%
Basque 11.32%
Sardinian 1.54%
West Asian 0.89%
South-west Asian 0.76%
North African 0.68%
South Asian 0.48%
East Asian 0.4%
East African 0%
Sub-Saharan 0%
North Eurasian 0%
DOD340
North-west European 55.28%
North-east European 25.88%
Basque 13.79%
West Asian 3.12%
North Eurasian 1.91%
North African 0%
South Asian 0%
Sardinian 0%
East Asian 0%
East African 0%
Sub-Saharan 0%
South-west Asian 0%
| Thumbs Up/Down |
| Received: 376/7 Given: 0/0 |
Strange you have East Asian but no North Eurasian.
Yet your East Asian might be part of what Dienekes mentioned, the noise appearing at this solution - I wouldn't bet too much on anything below 1 percent.
Last edited by Agrippa; 04-29-2011 at 03:18 PM.


| Thumbs Up/Down |
| Received: 46,328/1,221 Given: 47,347/2,169 |


| Thumbs Up/Down |
| Received: 5/3 Given: 1/0 |
DOD456
K=12
(north-Europe) :
NORTHWEST Euro = 31,71 %
NORTHEAST Euro = 7,43 %
(south-europe) :
SARDINIAN = 21,11 %
BASQUE = 17,24 %
-------
(others)
West Asian = 13,96 %
south-west Asian = 6,99 %
south-Asian = 0,06%
east asian = 0,00 %
east African = 0,78 %
west African = 0,58%
| Thumbs Up/Down |
| Received: 376/7 Given: 0/0 |
His new data is interesting:
http://dienekes.blogspot.com/2011/05...d-project.html
What I really wonder is that there are in fact 2 North Atlantic-Germanic clusters, with the one of the differences being, that in the 2nd one are two more Northern Balkanic individuals, 3 and 5 and in the first most British Isles people:
One could say North Atlantic vs. Continental Germanic/Central European Indo-Europeans. Scandinavians are split, I guess more Swedes fall into the 2nd cluster and Norwegians will be closer to the North Atlantid one of the British and Irish.
Would be my guess at least.
The two Balkan individuals are easy to explain, as the Balkan sample can be split into more Northern one and more "regional".
Dienekes says himself:
Notice also the asymmetry between γ(A, B) and γ(B, A). For example, the sample from the Balkans consists of an assortment of non-Greek people from the Balkans, so it's not particularly concordant with respect to many North European populations: people from the Balkans differ from each other substantially in their North European-ness. North European populations, however, tend to be concordant with respect to people from the Balkans.
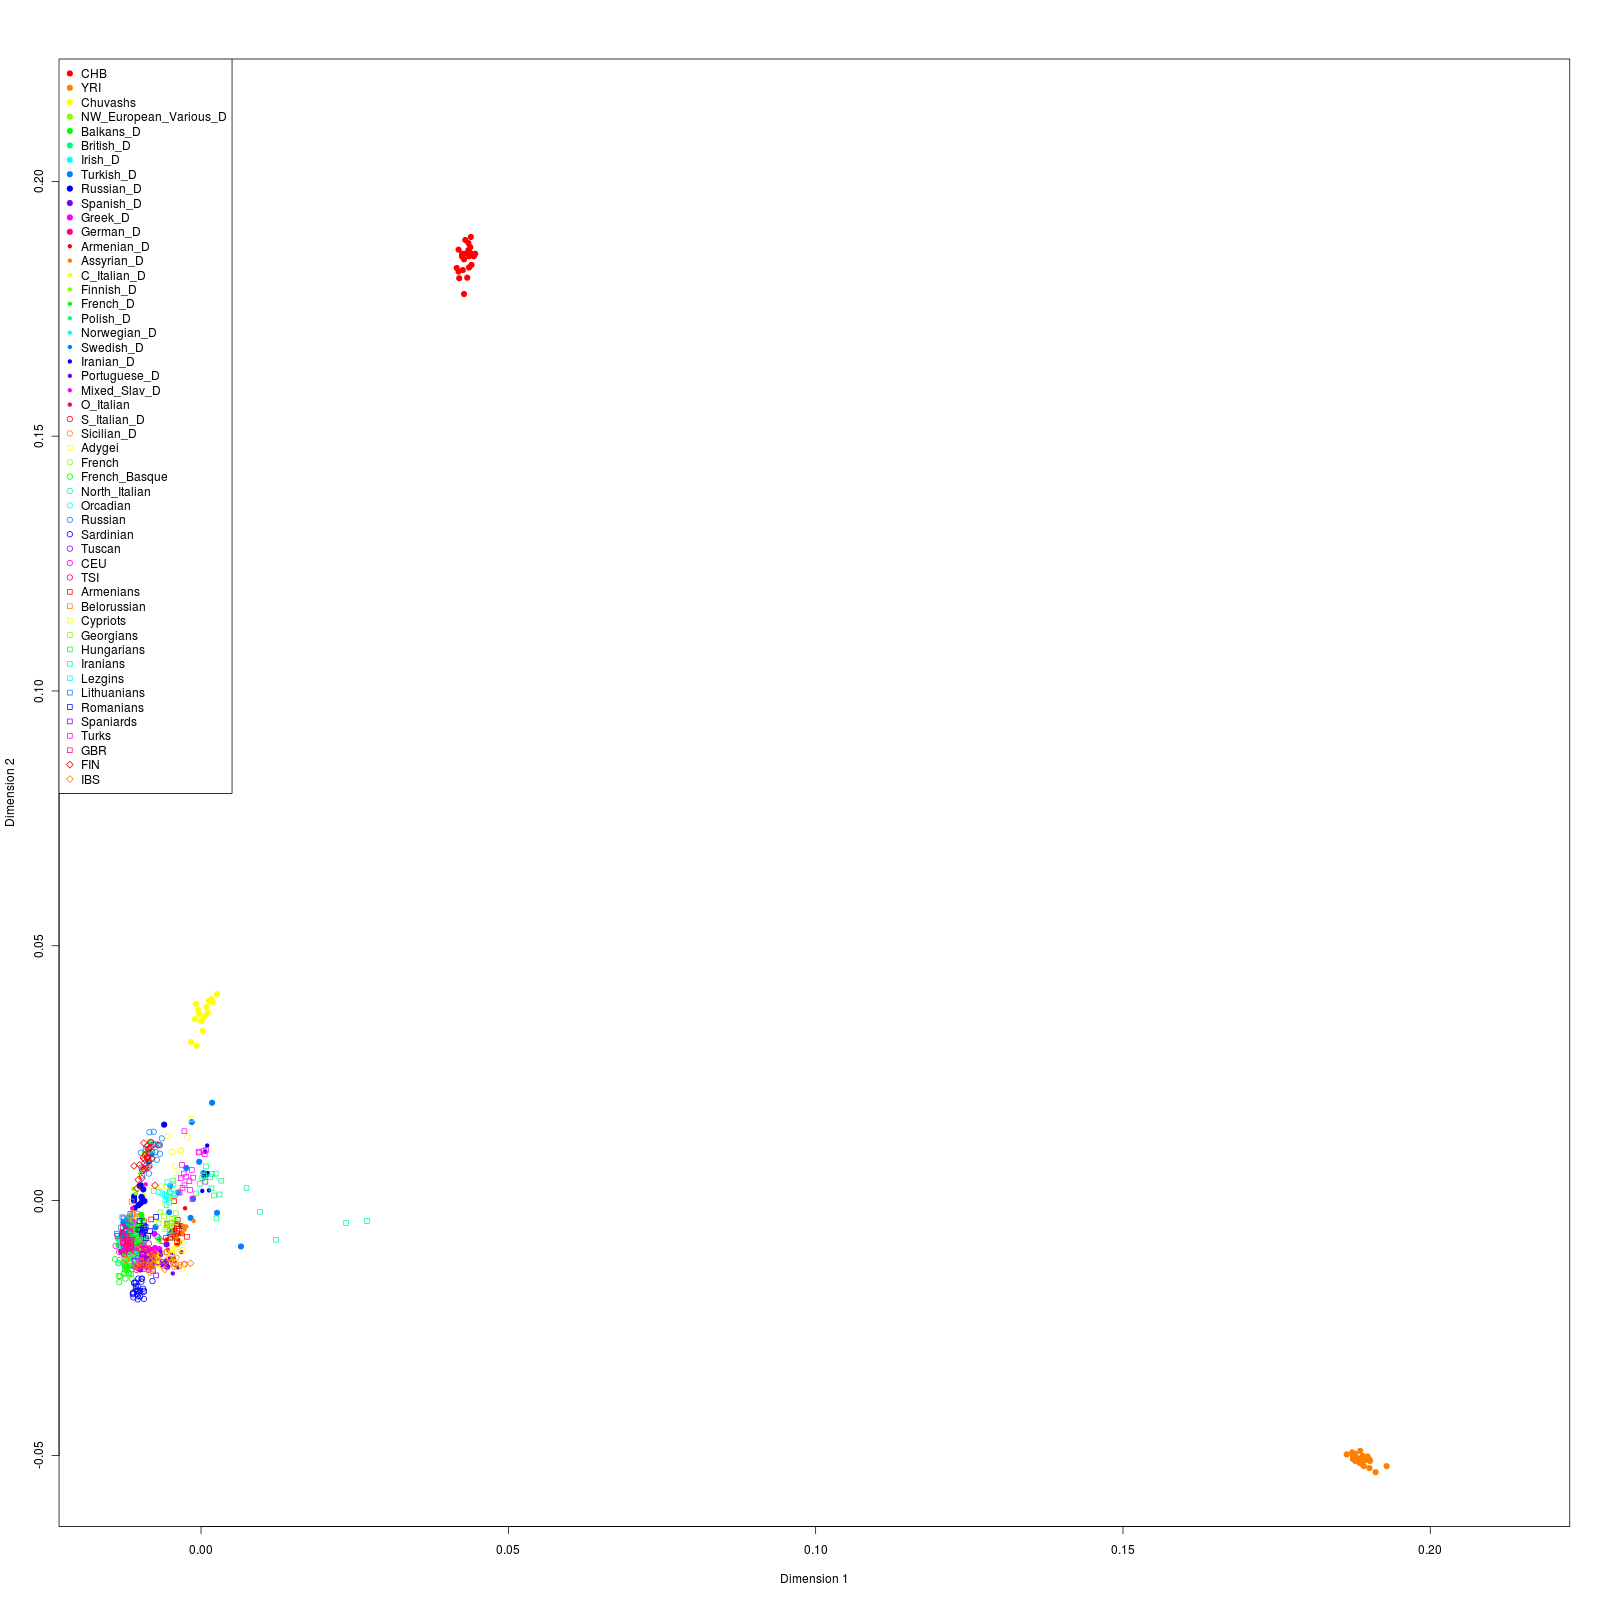
I know PC analysis can be strange on the graphic, but I wondered about this as well, because the Finns being closer to Ashkenazi than the Near Easterners in this depiction:
Which is very strange.
Otherwise everything else was like expected.
Last edited by Agrippa; 05-02-2011 at 08:25 AM.
| Thumbs Up/Down |
| Received: 46,328/1,221 Given: 47,347/2,169 |
This is why:Originally Posted by Loki

Help support Apricity by making a donation
| Thumbs Up/Down |
| Received: 2/0 Given: 0/0 |
West Eurasian PCA plot showing some implications
West Eurasians with Chinese and Yorubas

There are currently 5 users browsing this thread. (0 members and 5 guests)
 Posting Permissions

 Reply With Quote


Bookmarks