

0


| Thumbs Up/Down |
| Received: 7,328/30 Given: 2,686/16 |
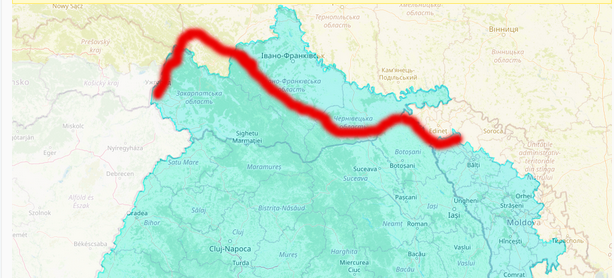
I think real border should follow the Carpathians (Lemkos, Hutzuls, Zakarpatian Rusyns), but as LivingDNa on this map is using administrative borders is too northern than in reality.Originally Posted by Ion Basescul


| Thumbs Up/Down |
| Received: 13,742/256 Given: 34,565/232 |
it doesn't contradict what I say: the population in northern Romania, northern Moldova and SW Ukraine owes its genetic mix mostly to demographic realities previous to Vlach expansion: their Neolithic Farmer genes should be mostly from the actual local Neolithic cultures (as it is, diluted down to 15-20% in SW Ukrainians). and yes there you have Chernivtsi oblast' Ukrainians and Suceava and Botosani county Romanians as well as northern Moldova Rep people with a mostly similar genetic breakdown of main components (Baltic, Atlantic, Mediterranean), I bet on a local stable mix that rather was initially Slavic. Vlachs did penetrate Ukrainian territory, but for the most melted into the Ukrainians on a more local and individual path than like getting entire communities Slavicized - that did not happen, only the contrary, Slavic inhabitants between Carpathians and Dniester got Romanianized linguistically. local persistence of Neolithic DNA (diluted, of course) is backed also by the continuity of I2 YDNA hg.
isn't there a way to more scientifically test that? that the Mediterranean genes of Moldovans and Ukrainians are Neolithic and not recent Vlach input (for the most). work has to be done to look more on an IBD way at ancestry in the region than macro components.


| Thumbs Up/Down |
| Received: 5,514/44 Given: 1,504/11 |
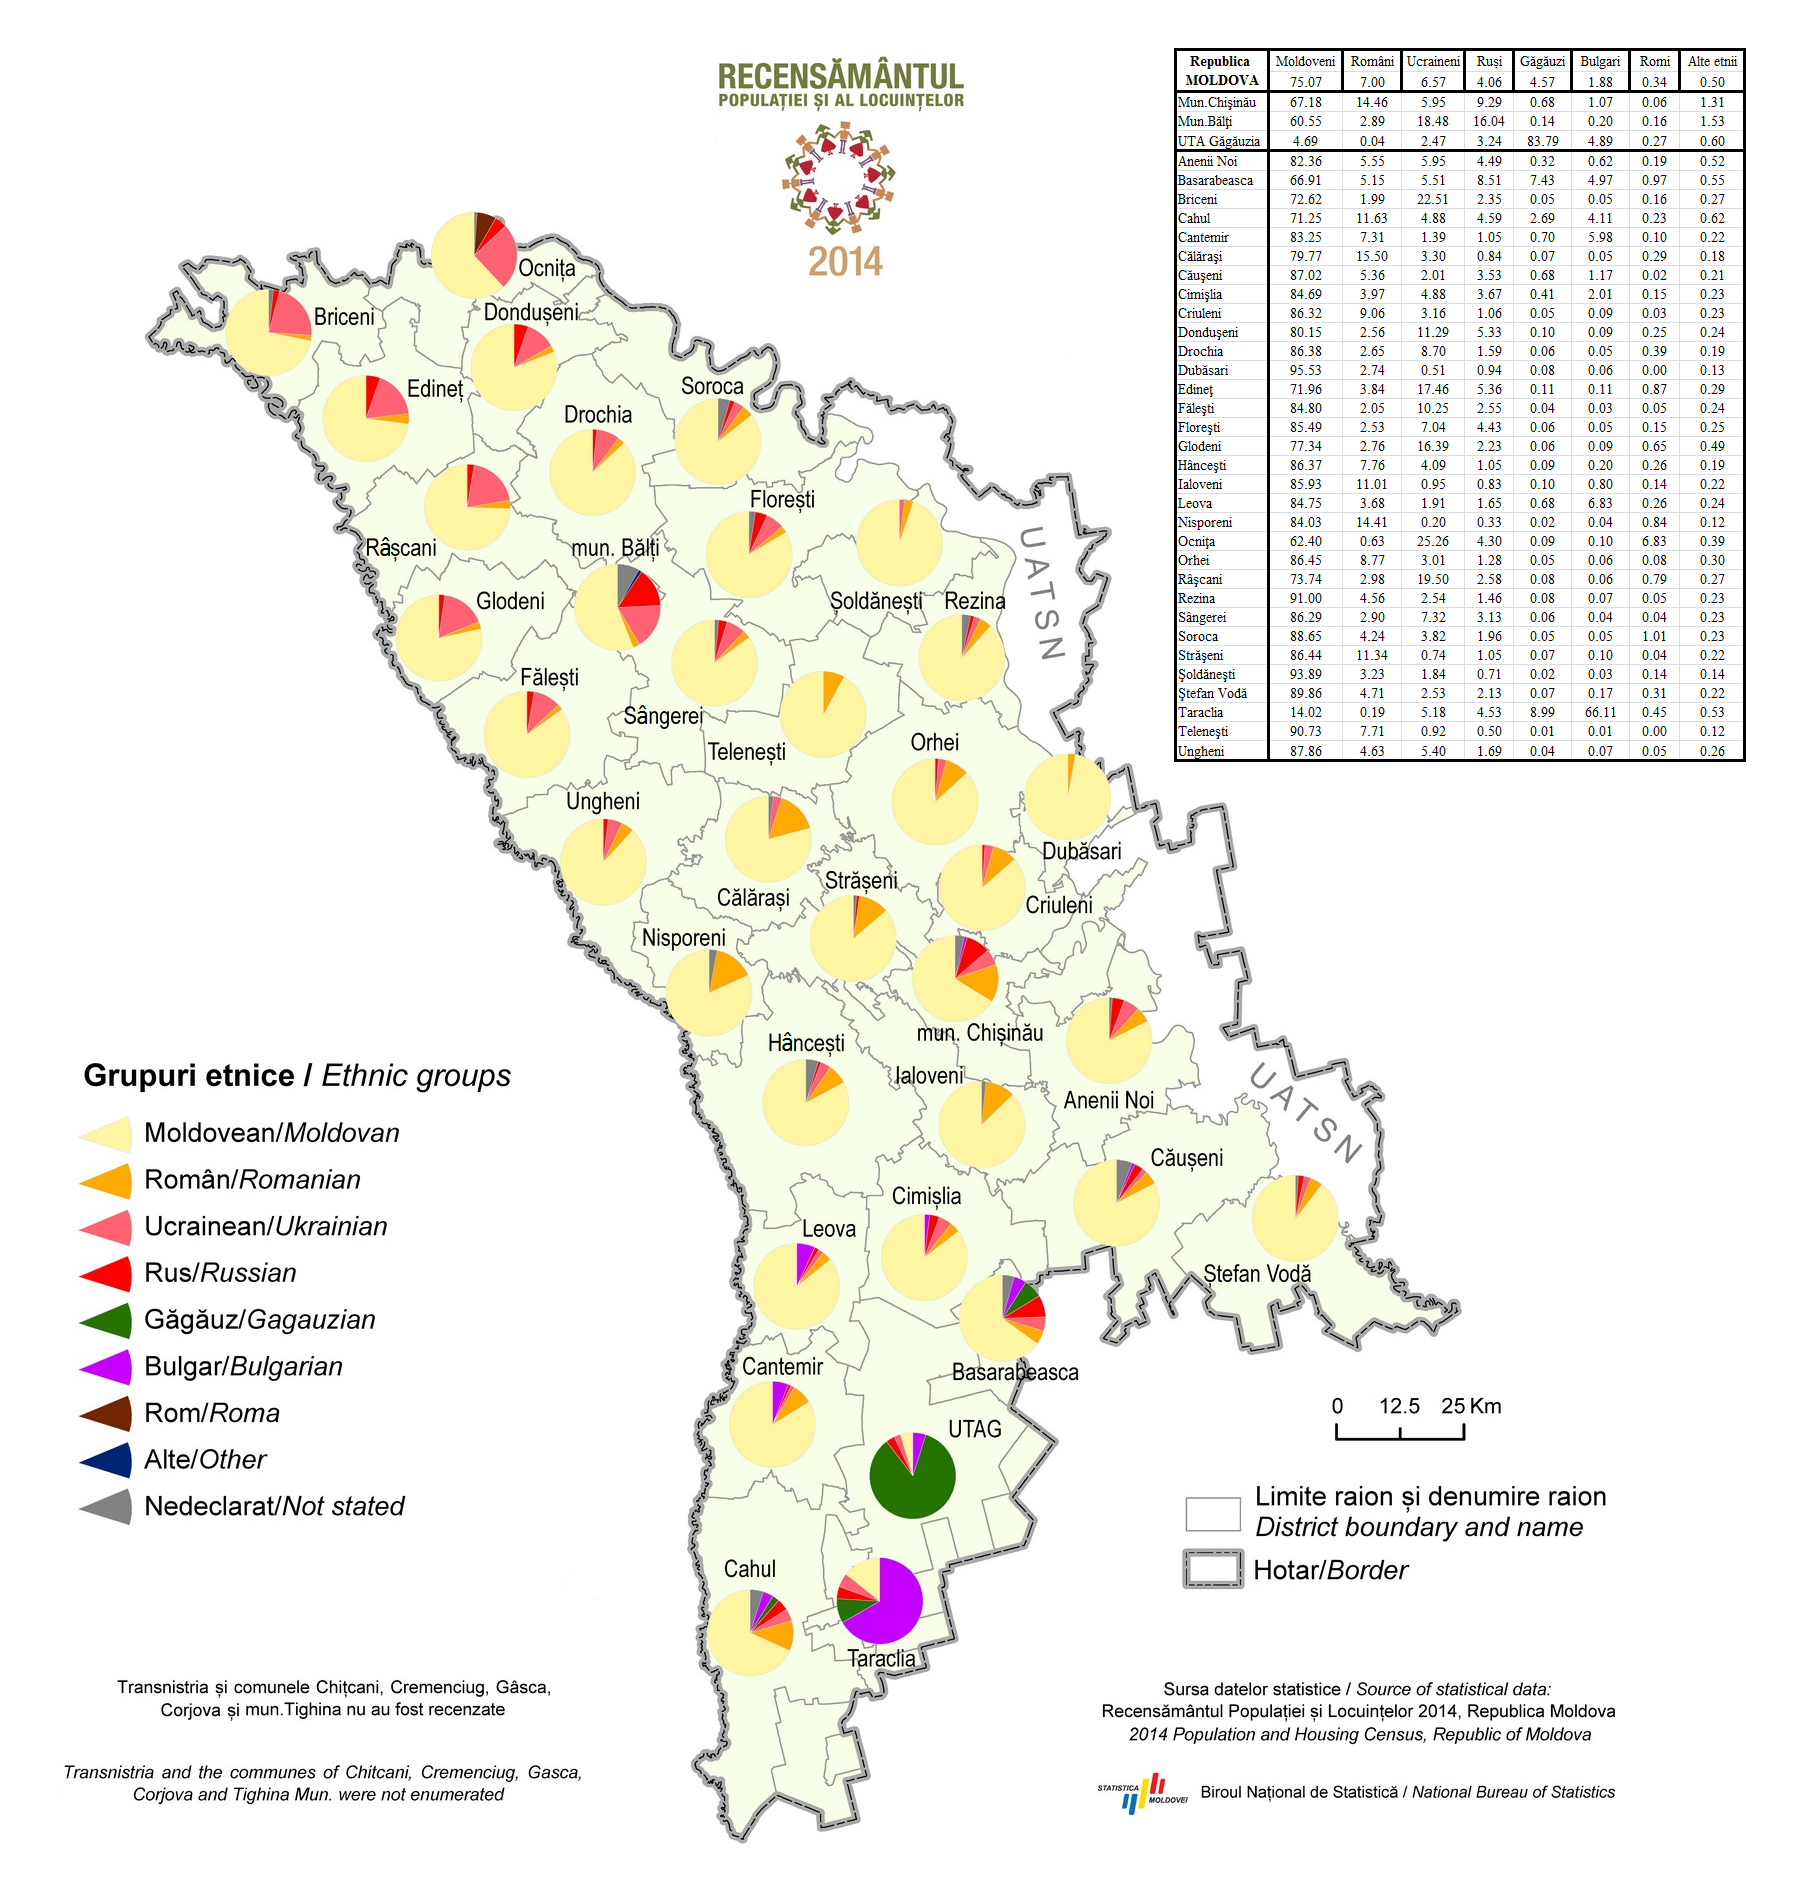
No, that map from LivingDNA is pure bullshit for Moldova, because I have Moldovans from those regions and they are not that different from others. But it is exactly in those districts, apart from Stefan Voda in the South and arguarbly Anenii Noi and Rezina in the Centre that there is a higher incidence of outliers. That's not a surprise to me, since surnames there are strongly non-Moldovan in origin. Many Ukrainians and Russians ran from serfdom and political persecutions to mainly Northern Moldova in the late 18th to 19th centuries and according to the map mainly settled along the Dniester. Many are completely assimilated linguistically, but the genes obviously don't disappear just like that if not mixed with local Moldovans.
So I guess that they must have stumbled on people of colonist descent. Otherwise I cannot explain why they are more Northern than Ukrainians immediately North of us.
| Thumbs Up/Down |
| Received: 5,514/44 Given: 1,504/11 |
Not really, in Northern Moldova you have plenty of people with "Central"-like profiles. To me it's pretty clear why there are divergences. They are simply mixed.
The purest Moldovans are centred in the districts around Chisinau where they can constitute up to 99% of the population. In both the South and North there are plenty of people with colonist backgrounds. Such is the reality.
| Thumbs Up/Down |
| Received: 5,514/44 Given: 1,504/11 |
Here are my matches lol

Last edited by Ion Basescul; 02-17-2021 at 07:55 PM.

| Thumbs Up/Down |
| Received: 62/0 Given: 171/1 |
Also two kits from Hmelnytska oblast (I dont know exact districts):
1.
2.Admix Results (sorted):
# Population Percent
1 Baltic 44.45
2 North_Atlantic 24.01
3 West_Med 12.1
4 West_Asian 7.95
5 East_Med 7.82
6 Amerindian 1.38
7 Oceanian 0.81
8 Northeast_African 0.5
9 South_Asian 0.47
10 Siberian 0.28
11 Red_Sea 0.24
Single Population Sharing:
# Population (source) Distance
1 Ukrainian 4.55
2 Ukrainian_Lviv 4.85
3 Southwest_Russian 5.33
4 Ukrainian_Belgorod 5.56
5 South_Polish 6.78
6 Polish 7.28
7 Russian_Smolensk 7.38
8 Estonian_Polish 7.88
9 Croatian 8.45
10 Belorussian 8.97
11 Kargopol_Russian 10.51
12 Moldavian 10.56
13 Erzya 11.57
14 Lithuanian 12.28
15 Estonian 13.59
16 Hungarian 13.69
17 Finnish 15.41
18 East_Finnish 15.76
19 Southwest_Finnish 16.17
20 East_German 16.25
Mixed Mode Population Sharing:
# Primary Population (source) Secondary Population (source) Distance
1 91.6% Ukrainian_Belgorod + 8.4% Sardinian @ 2.52
2 92.5% Southwest_Russian + 7.5% Sardinian @ 3.02
3 64.7% Lithuanian + 35.3% Bulgarian @ 3.07
4 70.2% Southwest_Russian + 29.8% Moldavian @ 3.18
5 76% Lithuanian + 24% Central_Greek @ 3.23
6 83.7% Southwest_Russian + 16.3% Bulgarian @ 3.26
7 69.2% Ukrainian_Belgorod + 30.8% Moldavian @ 3.3
8 65.1% Southwest_Russian + 34.9% Croatian @ 3.31
9 63.6% Ukrainian_Belgorod + 36.4% Croatian @ 3.33
10 88.1% Southwest_Russian + 11.9% Greek_Thessaly @ 3.34
11 72.1% Lithuanian + 27.9% Greek_Thessaly @ 3.36
12 83.1% Ukrainian_Belgorod + 16.9% Bulgarian @ 3.38
13 87.5% Ukrainian_Belgorod + 12.5% Greek_Thessaly @ 3.41
14 90.2% Southwest_Russian + 9.8% Central_Greek @ 3.41
15 78.1% Lithuanian + 21.9% South_Italian @ 3.45
16 54.2% Moldavian + 45.8% Lithuanian @ 3.45
17 81.3% Lithuanian + 18.7% Cyprian @ 3.46
18 91.2% Southwest_Russian + 8.8% South_Italian @ 3.46
19 83.3% Southwest_Russian + 16.7% Romanian @ 3.47
20 90.6% Southwest_Russian + 9.4% East_Sicilian @ 3.49
The second is very similar to this one:Admix Results (sorted):
# Population Percent
1 Baltic 46.35
2 North_Atlantic 30.21
3 West_Med 9.25
4 West_Asian 5.6
5 East_Med 4.74
6 South_Asian 1.46
7 Siberian 1.28
8 Oceanian 0.66
9 Amerindian 0.46
Single Population Sharing:
# Population (source) Distance
1 Polish 2.44
2 Russian_Smolensk 3.23
3 Estonian_Polish 3.76
4 Belorussian 3.83
5 Ukrainian 4.38
6 Southwest_Russian 4.43
7 South_Polish 4.57
8 Ukrainian_Belgorod 5.14
9 Ukrainian_Lviv 5.76
10 Estonian 7.16
11 Lithuanian 7.78
12 Kargopol_Russian 8.28
13 Finnish 9.15
14 Southwest_Finnish 9.83
15 East_Finnish 10.53
16 Erzya 11.3
17 Croatian 11.64
18 Hungarian 14.43
19 Moldavian 14.81
20 East_German 14.95
Mixed Mode Population Sharing:
# Primary Population (source) Secondary Population (source) Distance
1 63.4% South_Polish + 36.6% Lithuanian @ 1.04
2 65.2% Lithuanian + 34.8% Hungarian @ 1.28
3 55% Belorussian + 45% South_Polish @ 1.5
4 55.8% Estonian_Polish + 44.2% South_Polish @ 1.67
5 90.9% Russian_Smolensk + 9.1% Southeast_English @ 1.73
6 60.8% Russian_Smolensk + 39.2% South_Polish @ 1.74
7 87.1% Estonian_Polish + 12.9% North_German @ 1.78
8 90.2% Russian_Smolensk + 9.8% West_German @ 1.82
9 90.2% Russian_Smolensk + 9.8% Danish @ 1.82
10 91% Russian_Smolensk + 9% Orcadian @ 1.82
11 71.6% Polish + 28.4% Southwest_Russian @ 1.84
12 90.6% Russian_Smolensk + 9.4% South_Dutch @ 1.86
13 68.1% Polish + 31.9% Belorussian @ 1.86
14 89.5% Russian_Smolensk + 10.5% North_German @ 1.86
15 84.9% Russian_Smolensk + 15.1% East_German @ 1.87
16 91.7% Russian_Smolensk + 8.3% Southwest_English @ 1.88
17 90.5% Russian_Smolensk + 9.5% North_Dutch @ 1.88
18 88.3% Estonian_Polish + 11.7% West_German @ 1.88
19 88.3% Estonian_Polish + 11.7% Danish @ 1.88
20 91.7% Russian_Smolensk + 8.3% West_Scottish @ 1.91
Ukraine_Zhytomyrska:Zhytomyr_district_Veresy_EG600 049,30.13,46.36,9.70,3.06,8.04,0.22,1.01,0.00,0.90 ,0.43,0.00,0.00,0.16
| Thumbs Up/Down |
| Received: 13,742/256 Given: 34,565/232 |
Last edited by Nurzat; 02-28-2021 at 12:21 PM.
| Thumbs Up/Down |
| Received: 13,742/256 Given: 34,565/232 |
look how Suceava and Botosani counties look like 50-50 mixes of westcentral Moldova (Vaslui and Neamt counties) and Chernivtsi region (didn't include the 8% Siberian outlier from Zastavna), the two counties in northeastern Romania being a bridge between Romanians and Ukrainians (Tulcea in the southeast is the same, probably through mixing with local Hohol Ukrainians and Lipovan Russians):
Ukraine_Bukovina_Chernivtsi (Шернєуц)
24.02 N_Atlantic
35.22 Baltic
14.87 West_Med
8.42 West_Asian
10.7 East_Med
Romania_Bukovina_Suceava (Сушява)
25.81 N_Atlantic
31.48 Baltic
14.19 West_Med
8.48 West_Asian
13.81 East_Med
Romania_Moldova_Botosani (Ботшєнь)
25.19 N_Atlantic
31.9 Baltic
14.63 West_Med
8.83 West_Asian
14.46 East_Med
Romania_Moldova_Vaslui (Васлуй)
25.57 N_Atlantic
27.52 Baltic
15.61 West_Med
9.54 West_Asian
16.09 East_Med
Romania_Moldova_Neamt (Нямц)
24.64 N_Atlantic
26.93 Baltic
16.89 West_Med
10.8 West_Asian
14.49 East_Med
Romania_Dobrudja_Tulcea (Тулшя)
21.72 N_Atlantic
30.72 Baltic
16.41 West_Med
8.70 West_Asian
16.83 East_Med
Last edited by Nurzat; 02-28-2021 at 10:31 AM.
| Thumbs Up/Down |
| Received: 5,514/44 Given: 1,504/11 |
That average for Chernivtsi looks more like the average of Romanians there, rather than Ukrainians.
These are all Moldovans/Romanians from Chernivtsi:
Origin N_Atlantic Baltic West_Med West_Asian East_Med Red_Sea South_Asian East_Asian Siberian Amerindian Oceanian NE_African Sub-Saharan Cernauti 25.05 32.68 12.58 12.66 13.32 0.16 0.10 1.33 0.85 0.70 0 0.23 0.35 1/2 Costiceni, 1/2 Noua Sulita 23.12 37.30 11.60 10.61 14.04 0.14 0 0 1.60 0.85 0.10 0.40 0.24 Cernauti, 3/8 Ukrainian 22.57 39.44 13.22 4.79 14.99 1.85 1.09 0.26 1.79 0 0 0 0 Cernauti 27.94 29.90 13.97 8.17 10.84 4.59 1.30 1.34 0.76 0.27 0.75 0.15 0
Average (without the 3/8 Ukrainian)
N_Atlantic Baltic West_Med West_Asian East_Med Red_Sea South_Asian East_Asian Siberian Amerindian Oceanian NE_African Sub-Saharan 25.37 33.29 12.72 10.48 12.73 1.63 0.47 0.89 1.07 0.61 0.28 0.26 0.20
Last edited by Ion Basescul; 02-28-2021 at 12:39 PM.
| Thumbs Up/Down |
| Received: 62/0 Given: 171/1 |
Why almost south-western Ukrainians, despite a more significant Mediterranean admixture compared to other Ukrainians, are not close to Romanians and Vlachs in K-13? Because Romanians have West Med component approximately equal East Med. But south-western Ukrainians have West Med component approximately one and a half times more than East Med.
There are currently 1 users browsing this thread. (0 members and 1 guests)
 Posting Permissions

 Reply With Quote
Bookmarks