

0


| Thumbs Up/Down |
| Received: 391/29 Given: 482/72 |
Your ancestry doesn't match up with the results on Rochefaton's chart.


| Thumbs Up/Down |
| Received: 10,716/143 Given: 13,111/597 |
Well, that's the one he did for me.Originally Posted by Anachronistic

My results vary greatly from run to run.
Maybe the Swedes and Norwegians I'm compared to are short with light brown hair (which is me) instead of the stereotypical tall blonde ones.


| Thumbs Up/Down |
| Received: 79/0 Given: 37/0 |
Is the South Baltic admixture component in people from Italy, Spain, and Portugal attributed to the Goths, Visigoths, Vandals, and Slavic people who came to those countries? Is the South Baltic component also correlated with the haplogroup R1a?


| Thumbs Up/Down |
| Received: 14,296/151 Given: 3,333/0 |
I'm not sure, but Suebi and Vandals were both East Germanic. Visigoths were not, although they seem to have lived on the shores of the Baltic as well.
Click for peruvian rage:
Spoiler!

| Thumbs Up/Down |
| Received: 438/31 Given: 0/0 |
Hey Roche could you do a chart for me


| Thumbs Up/Down |
| Received: 295/1 Given: 132/0 |
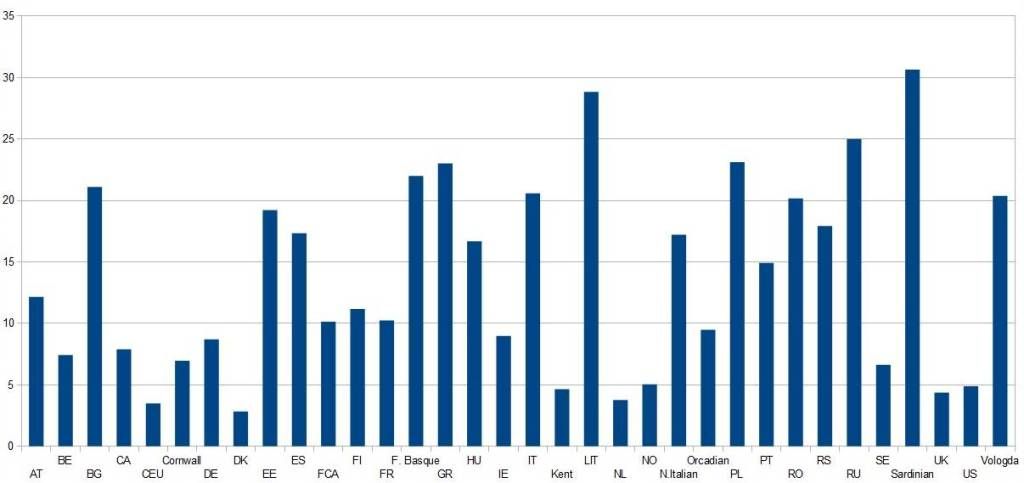
Graham:
Closest 5:
DK 2.84
CEU 3.49
NL 3.77
UK 4.38
Kent 4.65
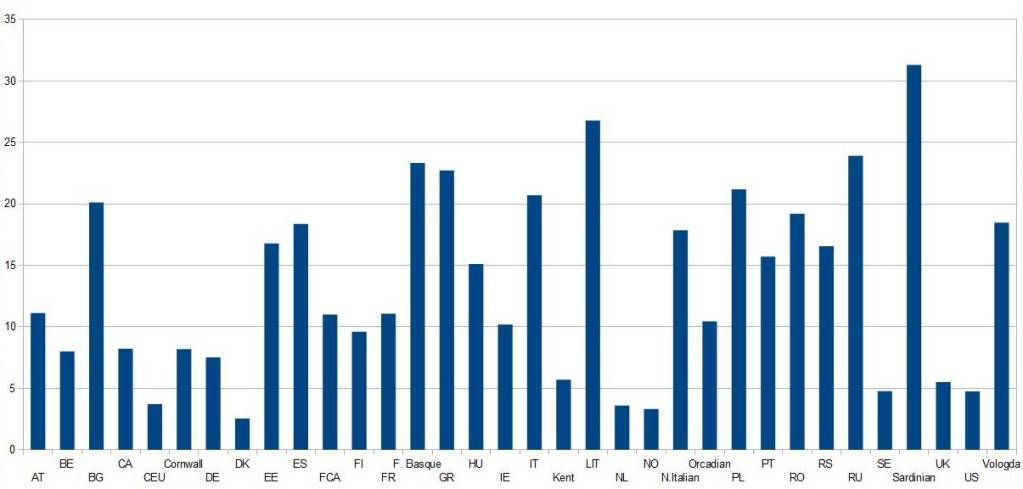
Pallantides:
DK 2.55
NO 3.32
NL 3.59
CEU 3.73
US 4.74
| Thumbs Up/Down |
| Received: 438/31 Given: 0/0 |
You are my hero!
| Thumbs Up/Down |
| Received: 14,296/151 Given: 3,333/0 |
New version of this picture with more samples. I made a red circle around me

Click for peruvian rage:
Spoiler!
| Thumbs Up/Down |
| Received: 438/31 Given: 0/0 |
Another red circle appear!

| Thumbs Up/Down |
| Received: 295/1 Given: 132/0 |
This latest run is showing some weird results for people of mixed ancestry. I don't know what reasoning there could be for this, and Polako is probably the only person that could give us an explanation.
All my spreadsheet does is apply the RMSD formula to the data Polako has produced.
There are currently 9 users browsing this thread. (0 members and 9 guests)
 Posting Permissions

 Reply With Quote

Bookmarks